
Figure 2.
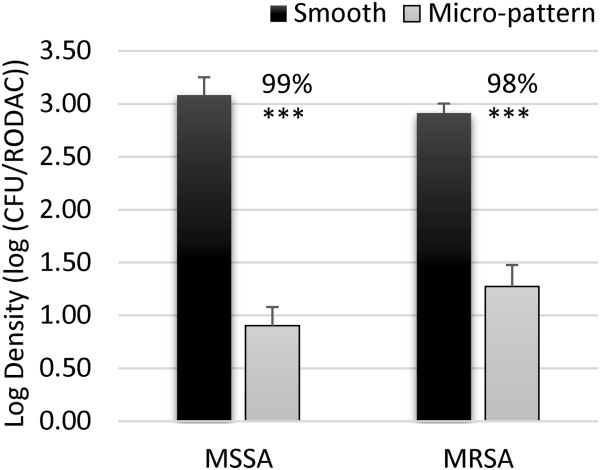
Microbial attachment. MSSA and MRSA were incubated in suspension on smooth (black bars) or micro-patterned (grey bars) acrylic film for 1 h. After rinsing 3 times and drying for 1 h the remaining viable bacteria on the surfaces were quantified. The plot represents average log densities and standard error of the mean. Significance was determined using a single t-Test of the log reduction data points. The average log reduction values were then used to calculate the median percent reduction values indicated above each column. p < 0.005 (***).