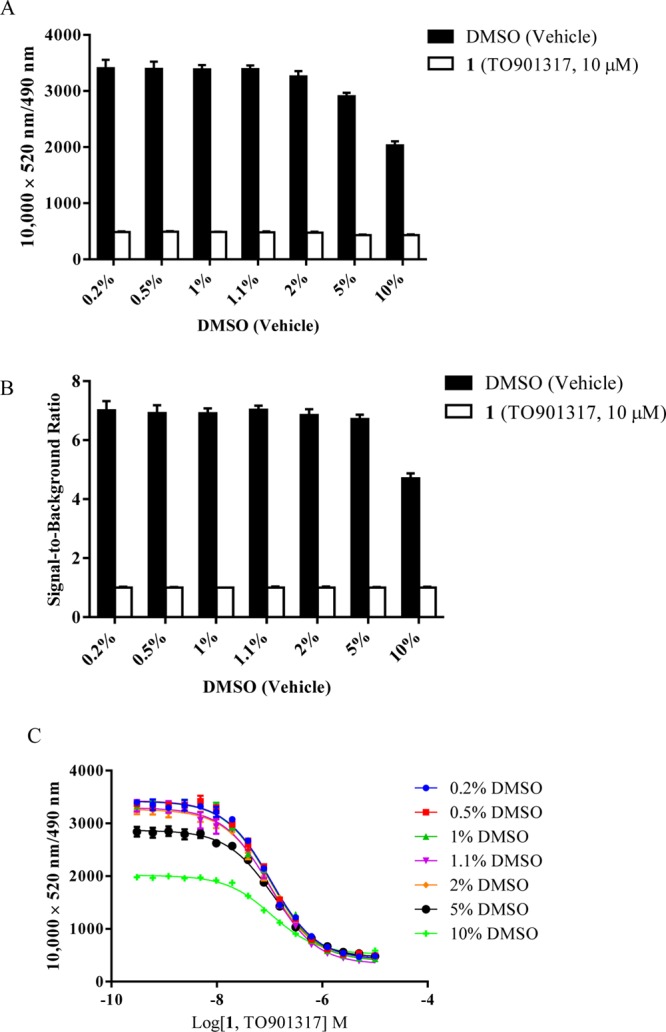
Figure 10.

DMSO tolerance in the interaction of 100 nM BODIPY FL vindoline (20) with 5 nM GST-hPXR-LBD and 5 nM Tb-anti-GST after 30 min of incubation. (A) Interaction of 100 nM BODIPY FL vindoline (20) with 5 nM GST-hPXR-LBD and 5 nM Tb-anti-GST in the presence of DMSO control or TO901317 (1, 10 μM) at the indicated final DMSO concentrations. (B) Signal-to-background ratio in the interaction of 100 nM BODIPY FL vindoline (20) with 5 nM GST-hPXR-LBD and 5 nM Tb-anti-GST in the presence of the indicated Me2SO concentrations. (C) TO901317 (1) dose–response curves in the presence of 100 nM BODIPY FL vindoline (20), 5 nM GST-hPXR-LBD, and 5 nM Tb-anti-GST at the indicated DMSO concentrations. For each DMSO concentration tested in both panels A and B, the difference between DMSO and TO901317 (1, 10 μM) was substantial and statistically significant (p < 0.0001).
