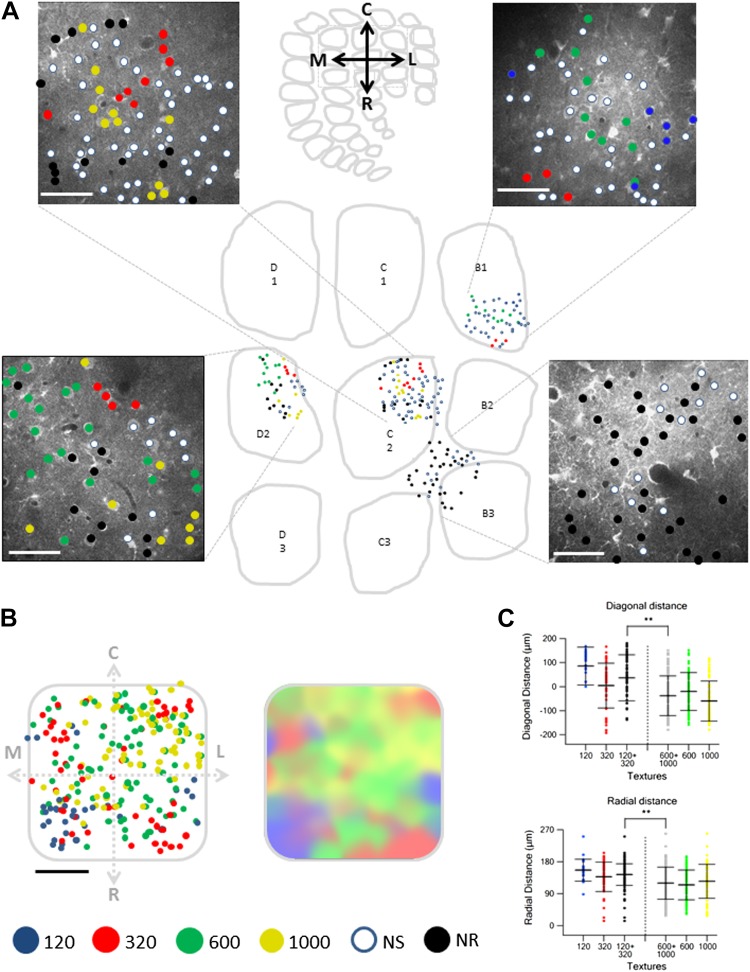
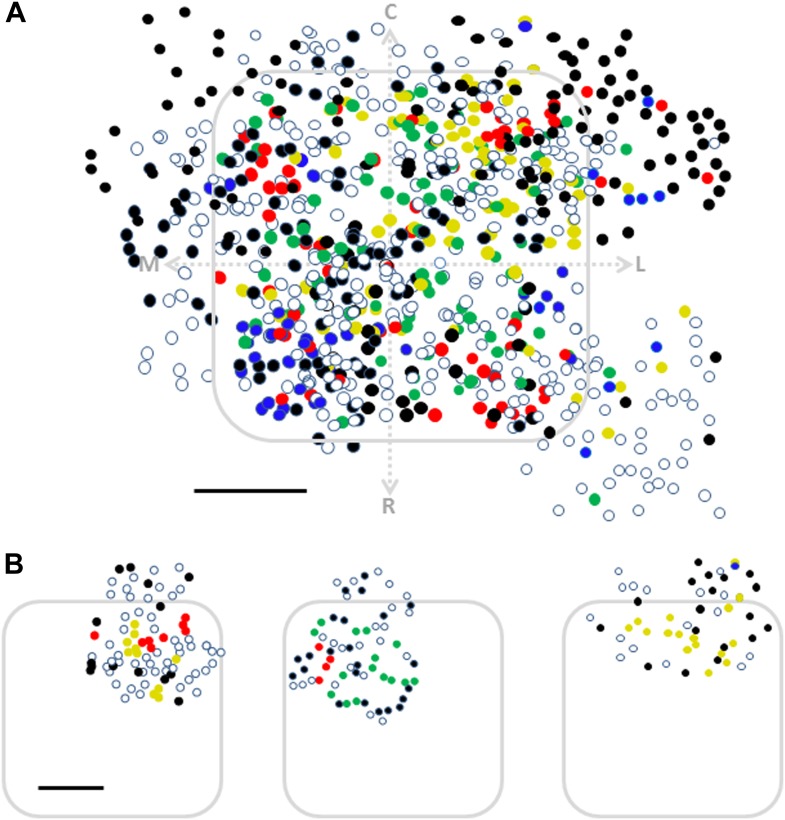
Figure 6. Spatial mapping of the preferred texture of neurons aligned to a normalized barrel.
(A) Examples of four spatial texture preference maps taken from four different brains (3 inside the barrel boundaries and 1 in the septa) are presented. We carefully aligned the neurons with the barrel field (Scale bar: 50 µm) (see Figure 2; ‘Materials and methods’ for details). (B) Left: superimposition of the spatial maps from 12 experiments onto a ‘normalized’ barrel (Scale bar: 100 µm), middle panel smoothened map. In 7 out of the 12 maps imaging location was determined using the electroporation method as described in Figure 2; in the remaining maps we used vertical blood vessels alignment. (The preferred textures of neurons were color coded as P120-blue originated from 6 rats, P320-red originated from 10 rats, P600-green originated from 8 rats, P1000-yellow originated from 10 rats, non-preferring-white and non-responsive-black.) (C) Distance from the MC-LR diagonal (upper) and radial distance from the center of the barrel (lower) of each cell in the different experiments is presented for each texture separately and for the combined coarser textures (black, P120 and P320) and finer textures (gray, P600 and P1000) (**p < 0.01 for comparison of coarser and finer textures). Comparison of the four textures with ANOVA was not significant for the radial distance and yielded a p < 0.01 for the distance from the MC-LR diagonal.


