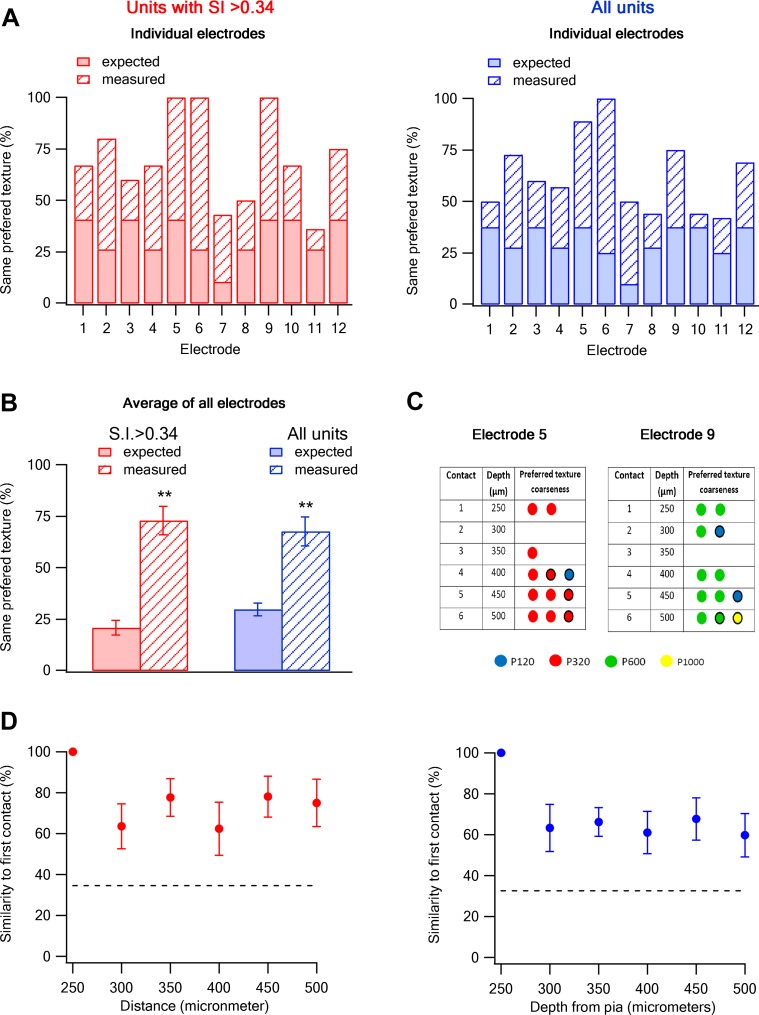
Figure 7. Columnar organization of preferred texture coarseness across layer 2–3 of the barrel cortex.
(A and B) Comparison of the measured (solid) and expected (striped) probabilities for having the same preferred texture coarseness across all neurons recorded in different vertical depth of layer 2–3 using single shaft multi-contact electrodes (inter-contact distance of 50 µm). The data are presented for each individual electrode (A) and for the average of all electrodes (B). The data is also shown for all neurons with S.I. > 0.34 (red) and for all responsive neurons (average ± SEM) (blue). The expected probabilities were calculated from all 133 neurons in 12 electrodes from 12 rats (single multi-contact electrode per rat). (C) The preferred texture coarseness of all units across the six contacts of two example individual single shaft multi-contact electrodes from two different rats (electrode 5 and 9 in panel A) Circle with black perimeter mark units with S.I < 0.35. (D) The probability of retaining the same preferred texture along the different vertical contacts of a single electrode in layer 2–3. We initially determined the dominant preferred texture coarseness in the first contact (250 µm from the pia). Later, we presented the probability neurons will have the same preferred texture coarseness in consecutive contacts. For this analysis, we only used electrodes in which the first recording contact showed a clear dominant preferred texture (at least 66% of neurons with the same preferred texture, 9 out of 12 electrodes with 93 neurons).

