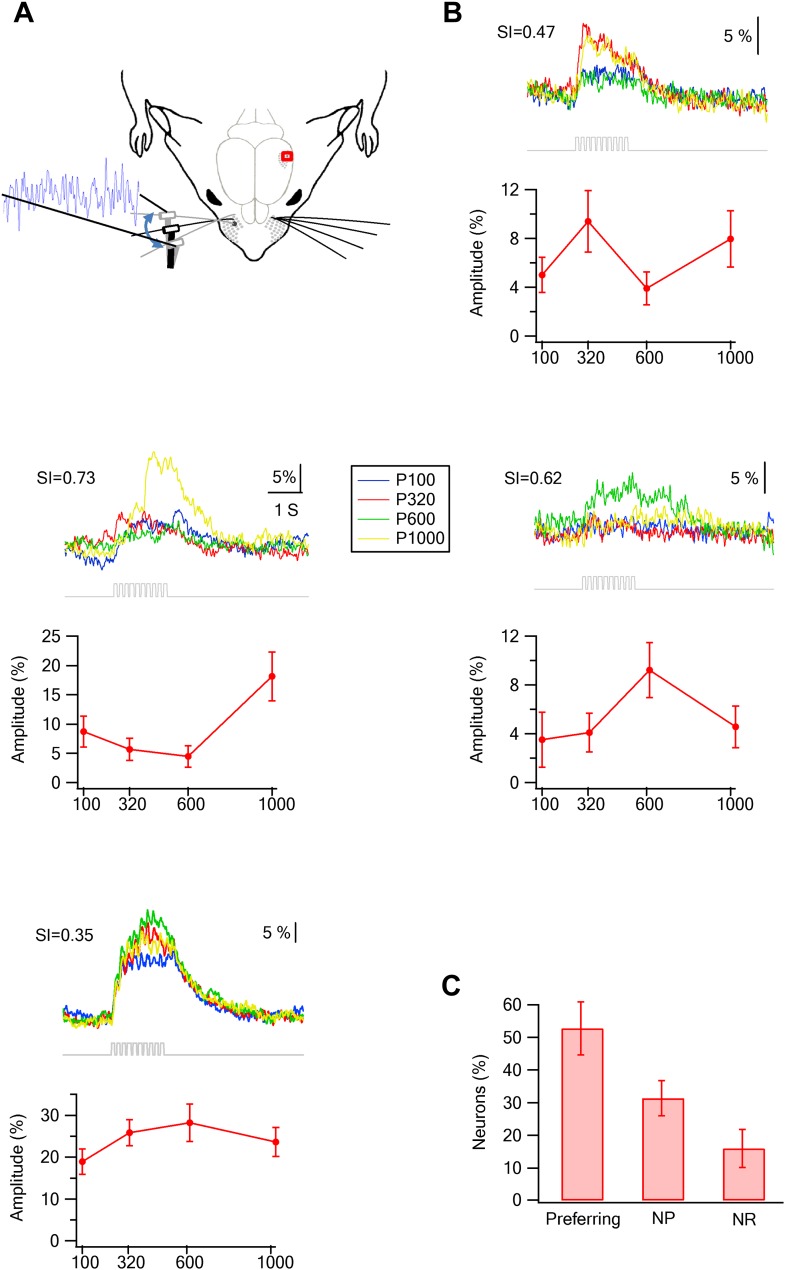
Figure 8. Preferred responses of neurons in layer 2–3 barrel cortex during passive replay of texture-like vibrations.
(A) Experimental set up. The principle whisker was passively stimulated using a galvanometer with four texture-like micro vibrations at amplitudes of 15–30 µm. (B) Examples of the average calcium transient responses (30 repetitions) of four neurons to different passive coarseness-like vibrations simulating the four different textures (upper panels) and their corresponding tuning curves (lower panels; mean ± SEM) as calculated from the peak of the averaged calcium response. For each cell the selectivity index (S.I.) is calculated and presented in the upper left corner (P100-blue, P320-red, P600-green, P1000-yellow). (C) The percentage of neurons (out of 324 neurons in five experiments) that were either texture-like preferring, non-preferring or non-responsive.


