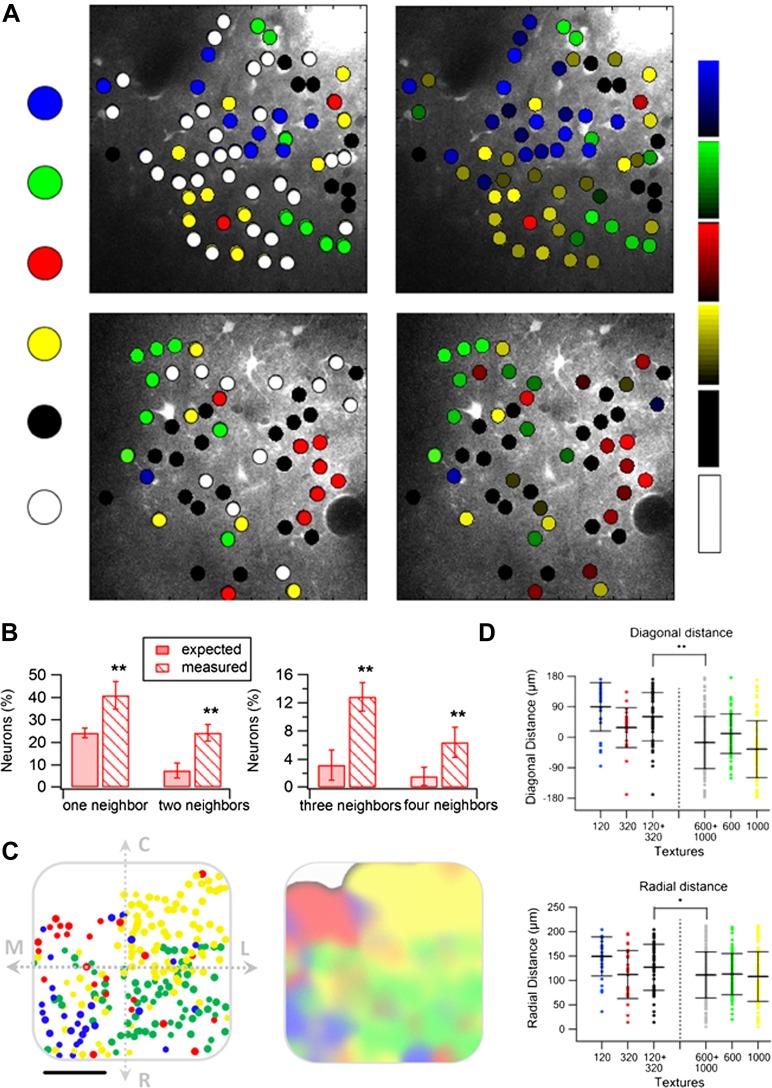
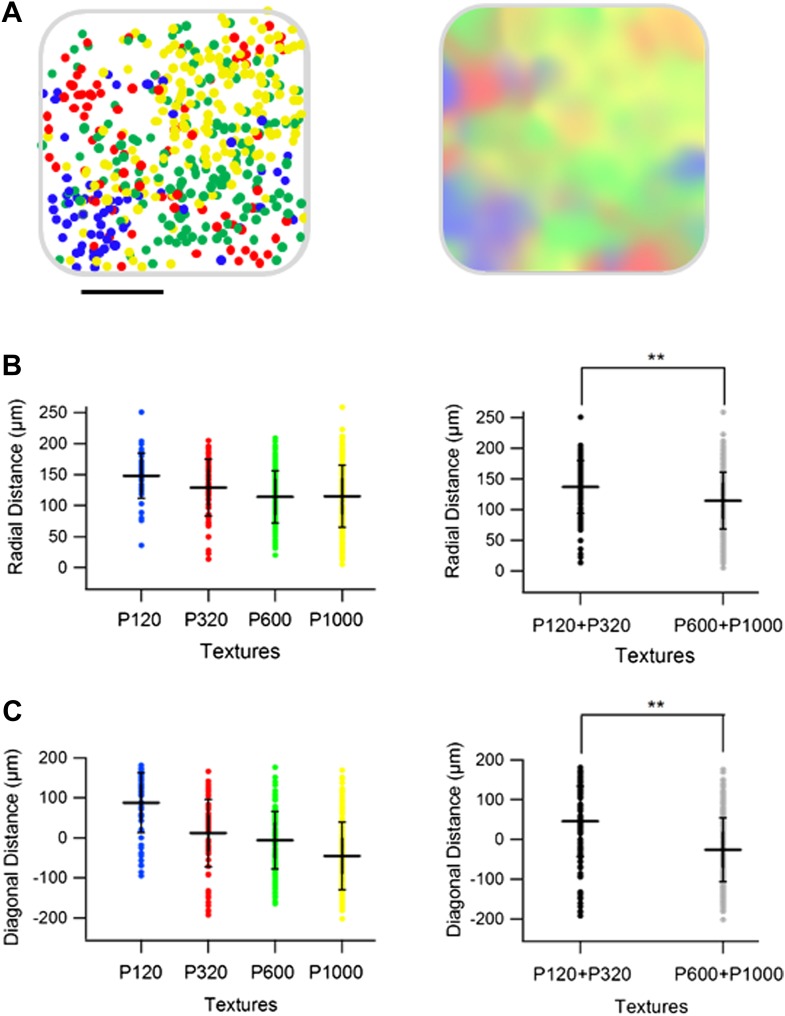
Figure 9. Spatial organization of responding neurons during passive replay of coarseness-like vibrational signals.
(A) (B) Left: texture-like preferring neurons (S.I. ≥ 0.35) from two experiments (upper and lower panels) were color coded according to their preferred simulated coarseness. Right: all responsive neurons (with no S.I. thresholding) were color coded according to their preferred texture coarseness (blue P120, red P320, green P600, yellow P1000, white non-preferring neurons and black non-responsive neurons), and the selectivity strength (S.I. value) which is depicted by the color scale (scale for each color is presented on the right, ranging from 0 to 1). (B) The probability of having 1, 2, 3, or 4 next neighbors with similar preferred simulated coarseness was calculated for the unthresholded maps and compared with the probabilities expected from random spatial distribution for all experiments performed (n = 6 rats) (**p < 0.01). (C) Superimposition of the passive maps from six experiments onto a ‘normalized’ barrel before (left), and after smoothing with a spatial filter (middle panel). In all six maps imaging location was determined using the electroporation method as described in Figure 2. (D) Distance from the MC-LR diagonal (upper) and radial distance from the center of the barrel (lower) of each cell in the different experiments is presented for each texture separately and for the combined coarser textures (black, P120 and P320) and finer textures (gray, P600 and P1000) (**p < 0.01 and *p < 0.05. Comparison of the four textures with ANOVA was not significant for the radial distance and yielded a p < 0.01 for the distance from the MC-LR diagonal.


