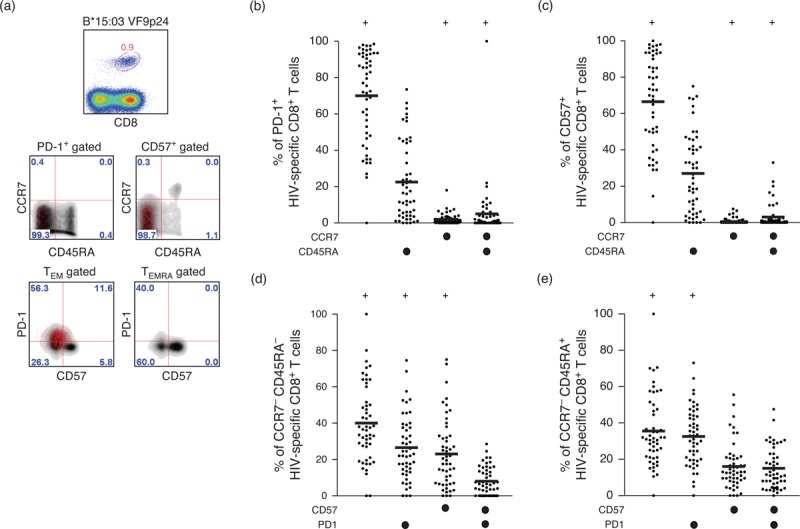
Fig. 5.
Programmed death-1 (PD-1) expression on HIV-1-specific CD8+ T cells is driven by the effecter memory population.

(a) Human leukocyte antigen (HLA)-B∗15 : 03 VF9-p24 tetramer-positive CD8+ T cells (top) pregated for PD-1 or CD57 expression and overlaid (red) on tetramer-negative bulk CD8+ T cells (grey) with respect to CCR7 and CD45RA expression (middle) or pregated for TEM (CCR7−/CD45RA−) or TEMRA (CCR7−/CD45RA+) phenotype and overlaid (red) on tetramer-negative bulk CD8+ T cells (grey) with respect to CD57 and PD-1 expression (bottom). (b and c) Expression of CCR7 and CD45RA (x-axis key) on a total of 52 different HLA-B∗15 : 03-restricted HIV-1-specific CD8+ T-cell populations from 15 participants pregated for PD-1 (b) or CD57 (c) positivity. (d and e) Expression of PD-1 and CD57 (x-axis key) on a total of 52 different HLA-B∗15 : 03-restricted HIV-1-specific CD8+ T-cell populations from 15 participants pregated for TEM (d) or TEMRA (e) phenotype. (f and g) Percentage frequencies for PD-1 expression on HLA-B∗42 : 01 (f) or HLA-B∗15 : 03 (g) tetramer-positive CD8+ T-cell populations within the TEM (CCR7−/CD45RA−) or TEMRA (CCR7−/CD45RA+) compartments. Horizontal bars depict mean values. In (b–c), ‘+’ indicates P < 0.05 compared with the CCR7−/CD45RA+ population. In (d–e), ‘+’ indicates P < 0.05 compared with the CD57+/PD-1+ population. In (f and g), ‘∗’ indicates P < 0.05 compared with FL9-Vpr values. Statistical analyses were conducted using the Student t test.
