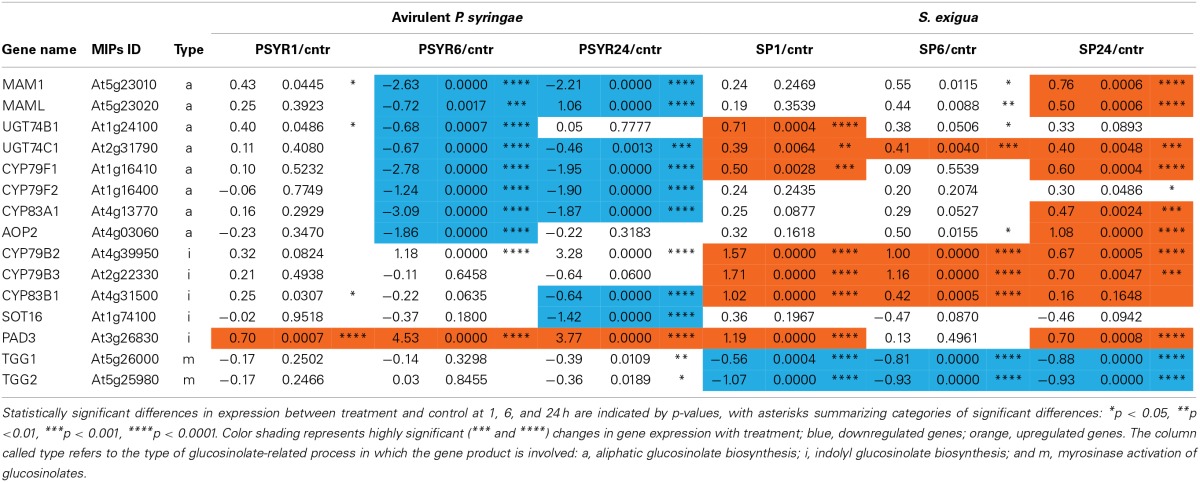
Table 1.
Expression (log2 of treatment/control) of Arabidopsis genes involved in glucosinolate biosynthesis and activity that are differentially expressed in response to attack by S. exigua and avirulent P. syringe pv. tomato.

Statistically significant differences in expression between treatment and control at 1, 6, and 24 h are indicated by p-values, with asterisks summarizing categories of significant differences: *p < 0.05, **p <0.01, ***p < 0.001, ****p < 0.0001. Color shading represents highly significant (*** and ****) changes in gene expression with treatment; blue, downregulated genes; orange, upregulated genes. The column called type refers to the type of glucosinolate-related process in which the gene product is involved: a, aliphatic glucosinolate biosynthesis; i, indolyl glucosinolate biosynthesis; and m, myrosinase activation of glucosinolates.
