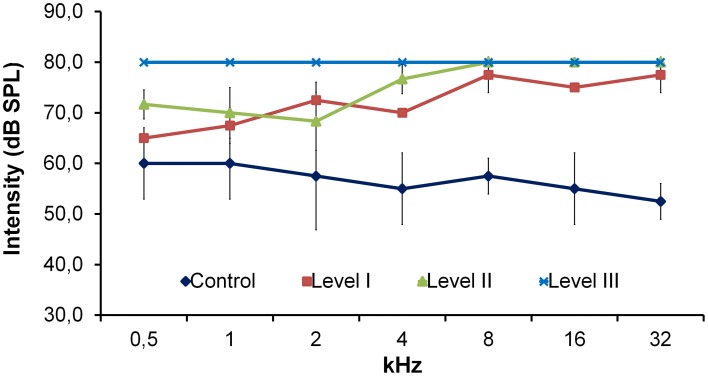
Figure 1.
Line graph showing the relationship between auditory thresholds and the frequency of the stimuli evaluated in the control SD rats (n = 2) and P23H rats. P23H rats were distributed according to their responses to natural stimuli into: Level I (n = 2), Level II (n = 3), and Level III (n = 10). The auditory threshold in P23H-1 rats was always higher than in SD rats. Data are expressed as mean ± standard deviation.

