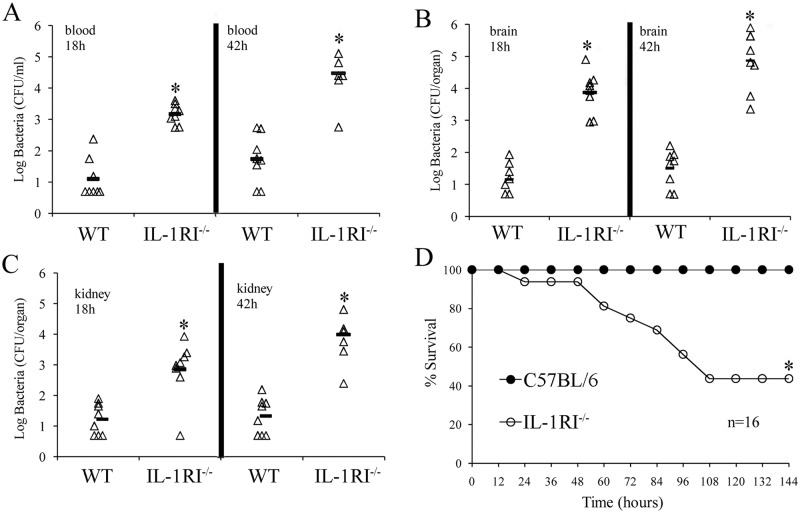
FIG 2 .
Effects of IL-1R signaling on infection outcome following an i.v. challenge with GBS. Blood (A), brain (B), and kidney (C) colony counts at 18 and 42 h after an i.v. challenge with 1 × 10⁶ CFU of GBS. Each determination was conducted with a different animal in the course of one experiment, involving eight animals per group. Horizontal bars indicate mean values. *, P < 0.05 versus WT mice, as determined by one-way analysis of variance and the Student-Keuls-Newman test. (D) Survival of WT C57BL/6 and IL-1RI−/− mice after an i.v. challenge with 1 × 10⁶ CFU of GBS. Shown are the cumulative results of two experiments, each conducted with eight animals per group. *, P < 0.05 versus WT mice as determined with a Kaplan-Meier survival plot.

