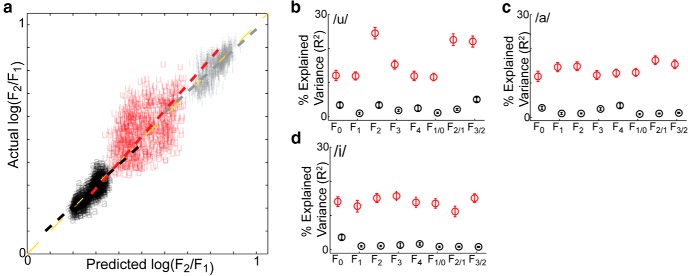
Figure 4.
Neural decoding of single-utterance acoustics within vowels. a, Scatter plot of predicted log(F2/F1) versus actual log(F2/F1) for decoders trained to predict the within-vowel variability from the cortical data for /a/ (black), /i/ (gray), and /u/ (red) individually. The yellow dashed line is the linear fit across vowels; the shorter dashed lines correspond to the linear fits within a vowel. b–d, Average decoding performance (% Explained Variance, R2) across formant features for decoders trained within a vowel (red) and across vowels (black) for /u/ (b), /a/ (c), and /i/ (d). Data are presented as mean ± SE, N = 24 recording sessions.

