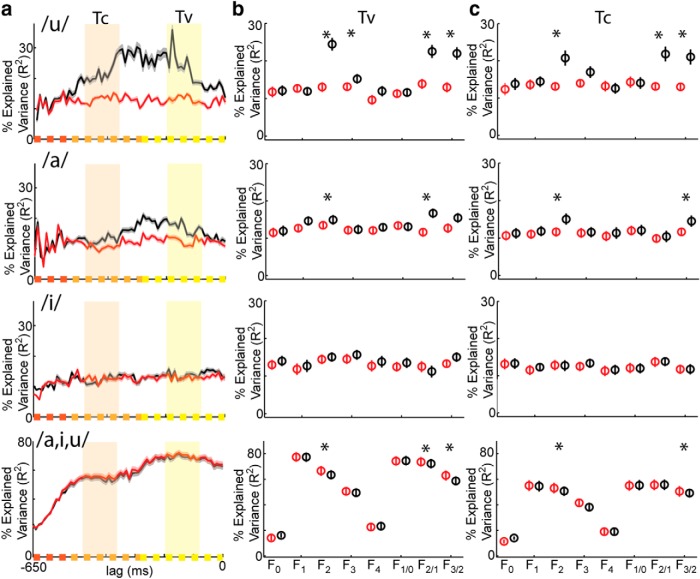
Figure 8.
A cortical source for coarticulation. a, Time courses of decoding performance (% Explained Variance, mean ± SE) for raw log(F2/F1; black) and residual log(F2/F1; red) after removing the effects of perseverative coarticulation that occurs because of the articulator engaged by the preceding consonant. Colored tick marks on the ordinate correspond to distinct temporal epochs in the structure of the underlying cortical data. Colored shaded region corresponds to time points at which decoding performance was calculated for vowel times (Tv, yellow) and consonant times (Tc, light orange). Time point 0 corresponds to the beginning of the acoustic measurement window. b, Decoding performance (mean ± SE) during vowel times (Tv) for raw formant features (black) and the feature residuals after removing the effects of perseveratory coarticulation (red). *p < 10−3 between decoding performance of raw formants and residual formants, Wilcoxon signed-rank test, N = 24. c, Decoding performance (mean ± SE) during consonant times (Tc) for raw formant features (black) and the feature residuals after removing the effects of perseveratory coarticulation (red). *p < 10−3 between decoding performance of raw formants and residual formants, Wilcoxon signed-rank test, N = 24.

