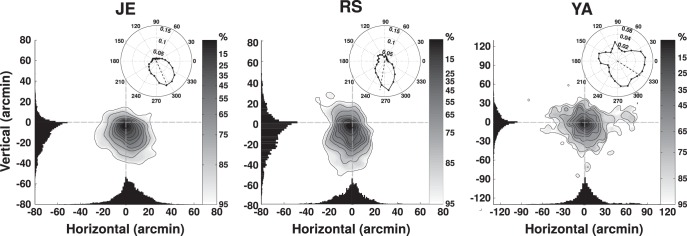
Figure 5.

Precision of fixation. Two-dimensional distributions of displacements of the retinal projection of the fixated target. Retinal traces were aligned by positioning their initial point at the origin of the Cartesian axes. The marginal probability density functions are plotted on each axis. The insert panels give the probability of finding the retinal stimulus displaced by any given angle relative to its initial position. Each column shows data from one subject.
