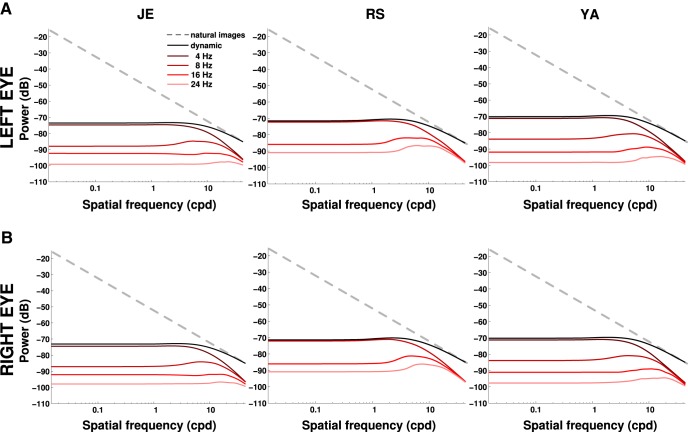
Figure 9.
Frequency content of the average retinal input during normal fixation in the natural world. The power of the external stimulus (natural images, dashed lines) is compared with the total power that becomes available at nonzero temporal frequencies because of fixational instability (dynamic, solid black line). The power distributions at individual temporal frequency sections are also shown. Each column shows data from one subject; rows A and B show the two retinas. Fixational head and eye movements whiten the retinal stimulus over a broad range of spatial frequencies.

