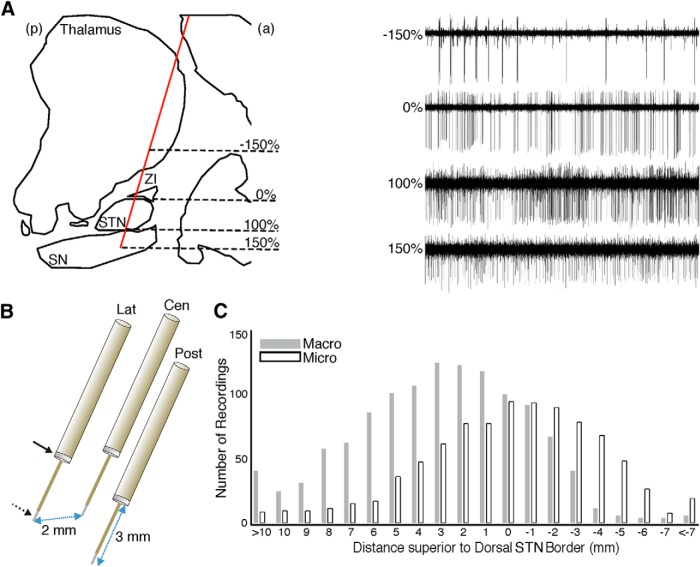
Figure 1.
Recordings of the parkinsonian BG. A, Sagittal view of an example trajectory (red) towards the STN, passing through the thalamus, zona incerta (ZI), and substantia nigra (SN). Microelectrode recordings (MERs; right) demonstrate typical cell recordings from these structures. The dorsolateral (0%) and ventromedial (100%) borders of the STN, as defined by MERs, were used to normalize recording locations across trajectories and STNs. a, Anterior; p, posterior. B, A triplet of targeting electrodes were simultaneously advanced, separated from each other in the anterior, posterior, medial, or lateral directions by 2 mm. Each targeting electrode comprises a macroelectrode (solid arrow) located 3 mm superior to the microelectrode (dotted arrow). Lat, Lateral; Cen, central; Post, posterior. C, Cumulative number of analyzed macroelectrode/microelectrode recordings at each recording depth across all trajectories demonstrating STN MERs.

