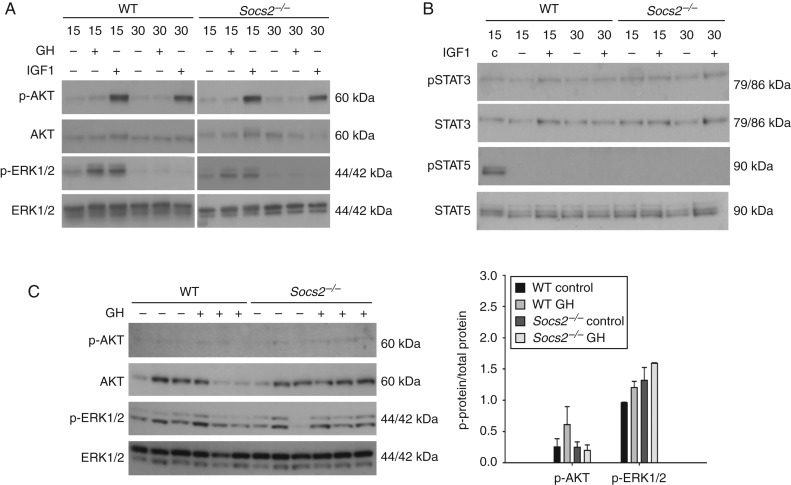
Figure 4.
SOCS2 regulation of GH or IGF1-induced AKT and ERK1/2 signalling. (A) Western blotting analysis of phosphorylated (P−) AKT and (P−) ERK1/2 in WT and Socs2 −/− osteoblasts challenged with GH (500 ng/ml) or IGF1 (50 ng/ml) for up to 30 min. (B) Analysis of phosphorylated (P−) STAT3 and STAT5 in WT and Socs2 −/− osteoblasts challenged with IGF1 (50 ng/ml) for up to 30 min. c, GH-treated WT osteoblast acting as a positive control. (C) Analysis of phosphorylated (P−) AKT and ERK1/2 in bone samples extracted from WT and Socs2 −/− mice following 15 min GH (3 mg/kg) treatment. Band intensities were quantified by densitometry and analysed for significance, as depicted in the graphs. Data presented as mean±s.e.m. (n=3).

 This work is licensed under a