
Figure 4 .
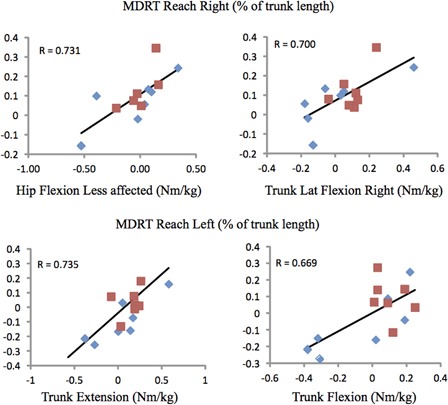
Scatterplots showing significant (P = 0.01) association between changes in sitting MDRT (% trunk length) for matched pairs of walkers (blue diamonds) (n = 7) and wheelers (red squares) (n = 7) and hip or trunk strength changes.
Official websites use .gov
A
.gov website belongs to an official
government organization in the United States.
Secure .gov websites use HTTPS
A lock (
) or https:// means you've safely
connected to the .gov website. Share sensitive
information only on official, secure websites.
Scatterplots showing significant (P = 0.01) association between changes in sitting MDRT (% trunk length) for matched pairs of walkers (blue diamonds) (n = 7) and wheelers (red squares) (n = 7) and hip or trunk strength changes.