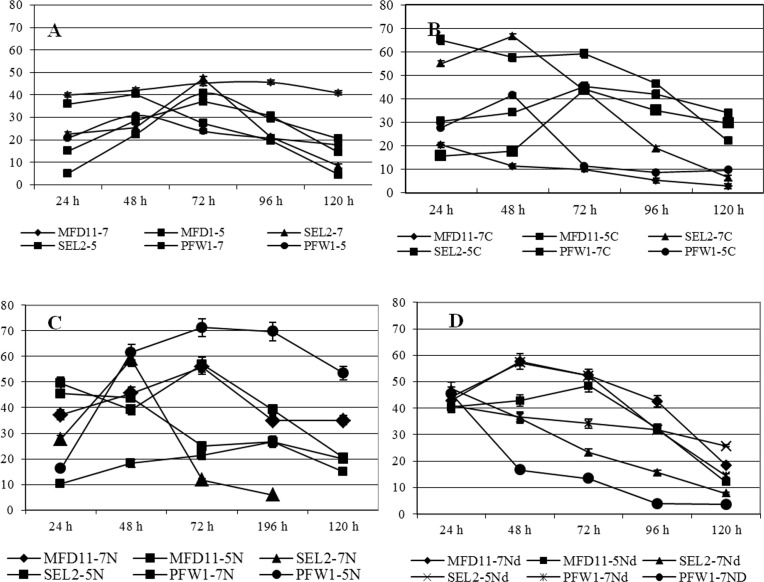
Figure 5.
The evaluation of the effect of power of hydrogen ion concentration (pH) on the PHA accumulation in different selected media by MFD11, SEL2 and PFW1, Y-axis; PHA production (%), X-axis; cultivation time (h). A: DAWM, B: PDM1, C: PDM2, D: PDM3, The digit 7 represents pH; 7.0 and 5 represents pH 5.0, Letter C represents carbon source; 2% molasses, N; 0.2% ammonium sulphate, Nd; 0.4% ammonium sulphate.

