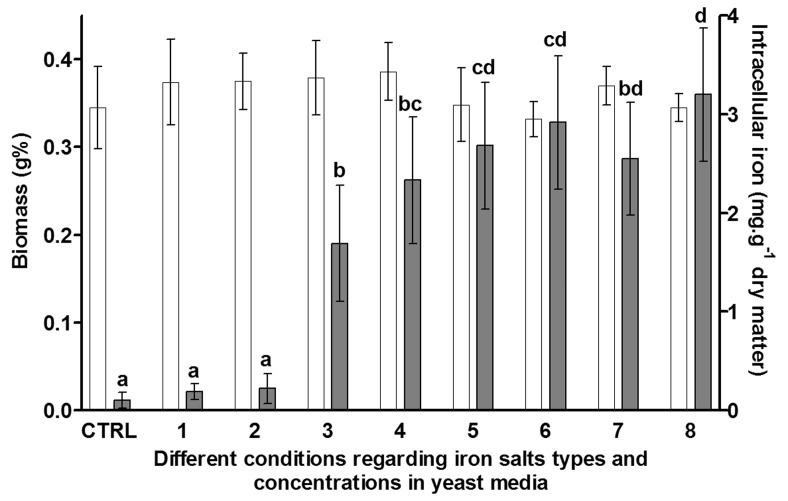
Figure 1.
The Saccharomyces cerevisiae intracellular iron concentration and biomass formation. Open and gray columns represent Saccharomyces cerevisiae biomass formation and iron uptake, respectively. The values are mean and 1-standard deviation (bars). Supplementation conditions: CTRL (control) without iron supplementation, 1 ferric EDTA 15 mg Fe L−1, 2 ferric EDTA 25 mg Fe L−1, 3 ferric citrate 15 mg Fe L−1, 4 ferric citrate 25 mg Fe L−1, 5 ferrous chloride 15 mg Fe L−1, 6 ferrous chloride 25 mg Fe L−1, 7 ferrous sulphate 15 mg Fe L−1, 8 ferrous sulphate 25 mg Fe L−1. The equal letters above gray bars represent that values of intracellular iron are not different (t-Student test, p < 0.05).

