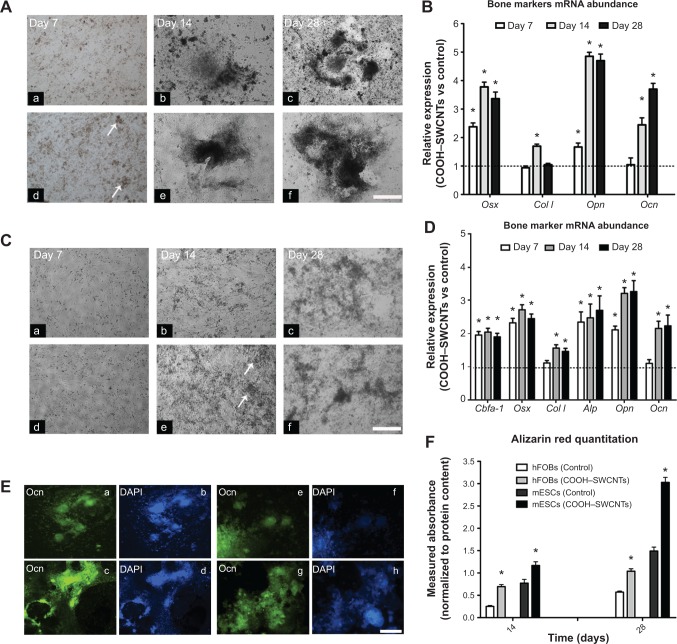
Figure 3.
Induced osteogenic differentiation in mESC and hFOB cell lines cultured on COOH–SWCNTs.
Notes: Representative images taken at days 7, 14, and 28 of mESCs (A) and hFOBs (C) on control (panels a–c), and COOH–SWCNT (panels d–f) substrates. White arrows denote formation of early-mineralized nodules into ECM. Scale bar =500 μm. Quantitative expression of bone-related markers shown in bar graphs (B, D, and F). Results normalized to endogenous B-actin relative to controls. Dashed lines (B and D) indicate values of target genes in control conditions; *P<0.01 vs respective control group. Immune-fluorescence images (E) depict presence of secreted Ocn (green color) in mESCs and hFOBs on control (panels a and e) and COOH–SWCNT (panels c and g) substrates. Scale bar =500 μm. Counterstaining with DAPI (blue color) is shown in (E) (panels b, d, f, and h). Bar graph (F) shows normalized alizarin red quantitation from hFOBs and mESCs on all substrates. *P<0.01.
Abbreviations: mESC, murine embryonic stem cell; hFOB, human fetal osteoblast; COOH–SWCNTs, carboxyl-modified single-walled carbon nanotubes; ECM, extracellular matrix; mRNA, messenger RNA; vs, versus; Ocn, osteocalcin protein; DAPI, 4’,6-diamidino-2-phenylindole; Cbfa-1, core-binding alpha factor I; Osx, osterix; Col I, collagen type I; Alp, alkaline phosphatase; Opn, osteopontin; Ocn, osteocalcin.

