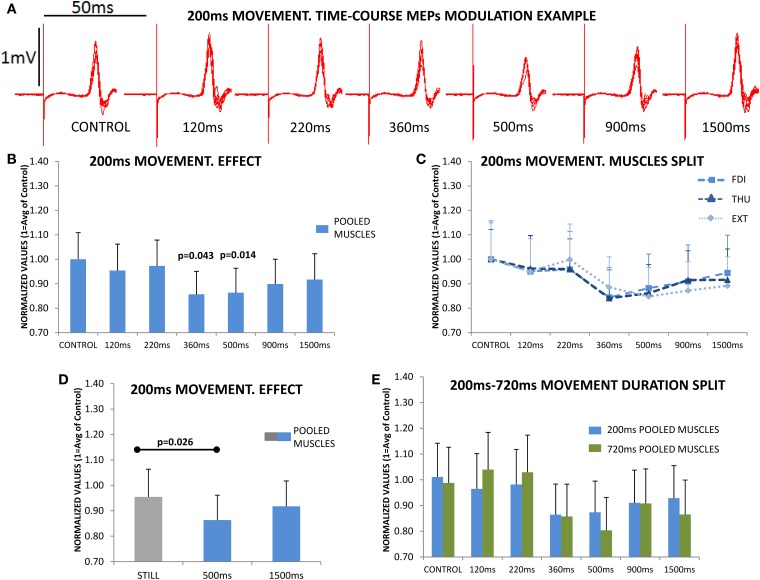
Figure 3.
The upper section (A) shows the overlaid traces from a representative subject at the different delays, and acquired during the observation of one of the 4 sets of the 200 ms movements. The reduction in the peak-to-peak amplitude of the motor evoked potential (MEP) immediately following the stimulus artifact at the 500 ms delay is obvious. (B) shows the mean subjects (n = 19) responses. MEP amplitudes were significantly reduced at 360 and 500 ms, and then recovered; the figure represents the responses of the three muscles pooled since they behaved similarly during movement observation (no significant differences); this can be observed in section (C) where the time-course modulation of the three muscles overlapped. (D) plots the responses during Still, which was significantly different compared to the 500 ms response, but not compared to 1500 ms response, again in all muscles. (E) shows the time-course modulation during the observation of movements lasting 200 ms (N = 19) and 720 ms (N = 17); normalized MEP amplitudes at each of different delays were never significantly different for 200 and 720 ms. Values are the mean and 1 s.e.m.

