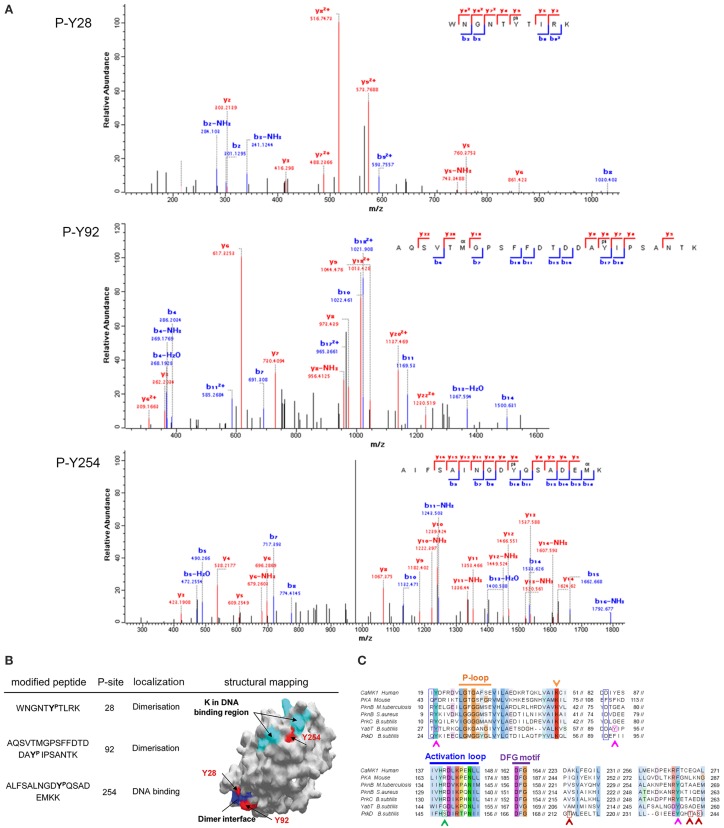
Figure 4.
Phosphorylation of YabT by PtkA. (A) Identification of phosphorylated residues by mass spectrometry. Fragmentation spectra for the three modified peptides, bearing the phosphorylated tyrosine residues 28, 92, and 254, are shown. (B) Mapping of the phosphorylated residues on the structural model of YabT obtained by SWISS-MODEL (surface representation). The phosphorylated residues are shown in red, residues in blue are associated with the region involved in the formation of dimers in YabT and in PknB (Rakette et al., 2012) and the residues in cyan represent the DNA binding region of YabT (Bidnenko et al., 2013). (C) Alignment of B. subtilis YabT, PrkC, and PrkD sequences with Hanks-type kinase homologs: the kinase domains of calcium/calmodulin-dependent protein kinase (CaMK1, human), protein kinase A (PKA, mouse), PknB from M. tuberculosis and Staphylococcus aureus. The P-loop, catalytic site (K), catalytic loop and the DFG motif are indicated (Young et al., 2003). The residues R9 and D75 in PknB of S. aureus which are involved in dimer formation (Rakette et al., 2012) are indicated with blue boxes. For YabT, the residues Y28, Y92 and Y254, which are phosphorylated by PtkA, are indicated with pink boxes and arrows. For PrkD, the residues T213, T241, and S243, which is phosphorylated by PrkC, are indicated with red boxes and arrows, and the S148, which is phosphorylated by HprK/P, is indicated with a green box and arrow.

