Figure 8.
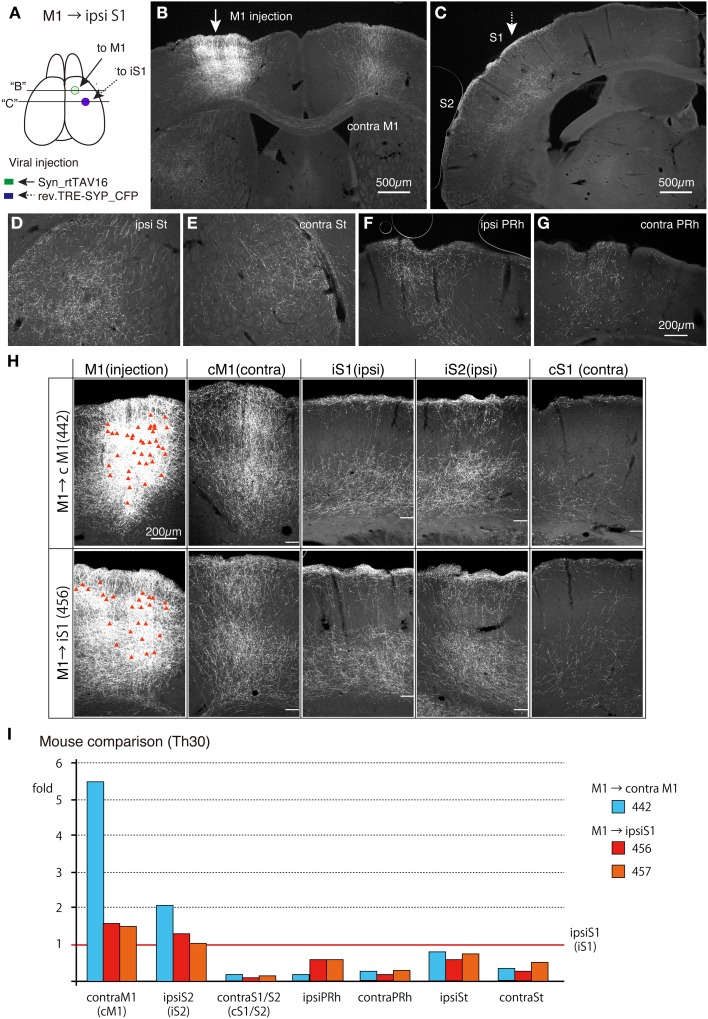
Collateral projections of ipsilateral S1-projecting CC cells in M1 are similar to those of the callosal CC cells. AAV vector encoding Syn-rtTAV16 was injected into M1 (shown by an arrow in A,B) and the NeuRet vector carrying TRE-SYP_CFP were injected into the ipsilateral S1 (shown by an broken arrow in A,C), and the CFP expression was detected by immunostaining. (A) Schematic view of double injection. The coronal planes of two injections indicated by “B” and “C” are shown in (B,C). (B) The arrow indicates the injection site for AAV:syn-rtTAV16. Note that the projections to the contralateral M1 are all collateral projections of the ipsilateral-S1 projecting cells. (C) The broken arrow indicates the injection site for NeuRet:TRE-SYP_CFP. The terminal distributions shown here are essentially the same as those observed for the callosal CC cells and concentrated in layers 1, 5, and 6 across areas S1 and S2 (see Figure 7F). (D–G) Collateral projections to ipsilateral striatum (ipsi St), contralateral striatum (contra St), ipsilateral perirhinal cortex (ipsi PRh) and contralateral perirhinal cortex (contra PRh). These panels are at the same magnification scale. (H) Comparison of collateral projections of the callosal (upper panels) and ipsilateral-targeting (lower panels) cells in M1. The red triangles in the injection sites indicate the cell bodies of the labeled cells. The white bars in other panels indicate the border between the gray and white matter. Note that the lamina pattern of terminal distributions is very similar across the two types of labeling. On the other hand, the relative abundance appears to be different, which was quantified in (I). In preparing these images, we combined the panels of the same mouse before adjusting the contrast, so that we can directly compare the staining intensities across different brain regions. (I) Abundance of collateral projections relative to those in the ipsilateral S1 was quantified (see Figure S3 for more detail). cM1, contral lateral M1; iS1, ipsilateral S1; iS2, ipsilateral S2; cS1, contralateral S1.

