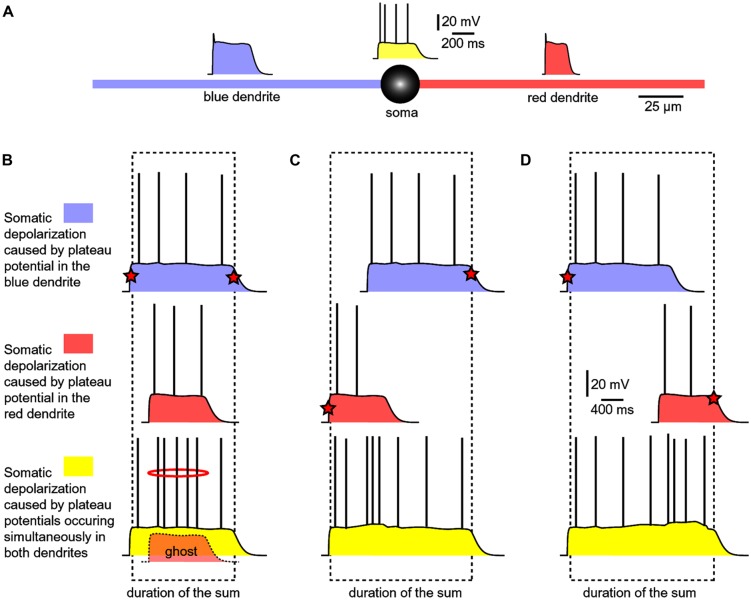
FIGURE 7.
Summation of dendritic plateau potentials on the soma. (A) Schematic diagram of a spiny neuron representing membrane potential transients occurring simultaneously on two basal dendrites and soma. Each column/panel (B–D) represents one experimental sequence. Each experimental sequence has three steps. In the first step, only blue dendrite received glut. stimulus (top trace). In the second step, only red dendrite received glut. stimulus (middle trace). In the third step, both dendrites received glut. stimuli (bottom trace). Dashed rectangle marks the beginning and the end of the somatic plateau potential in the bottom trace. Red star marks the summand which contributes to the leading edge or finishing edge of the sum (yellow trace). (B) The red plateau starts and finishes during the plateau phase of the blue plateau. “Ghost” potential is a copy of the red trace superimposed on the bottom trace with preserved timing. The red plateau is completely “eclipsed” by the longer blue plateau, as indicated by the “ghost” potential. (C) The red plateau starts before the blue plateau. Duration of the sum is determined by the onset of red and the collapse of blue plateau. (D) The blue plateau finishes before the red plateau phase is over. Duration of the sum is thus determined by the onset of blue and the collapse of red plateau.

