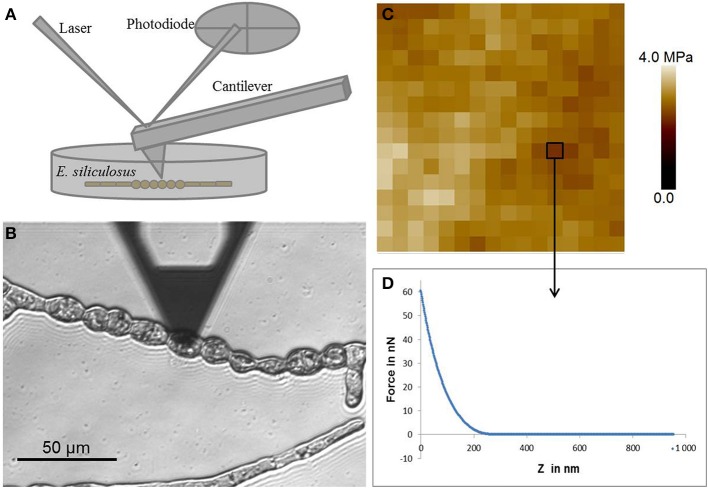
Figure 1.
Atomic force microscopy. (A) Schematic representation of the AFM setting. (B) Optical micrograph of the AFM cantilever located at the surface of a round cell of E. siliculosus filament. (C) Example of force curve, x axis represents the z motion of the cantilever and y axis represents the force applied at the surface of the cell. (D) Elasticity map of a 1 μm2 area consisting of an array of 16 by 16 force curves.

