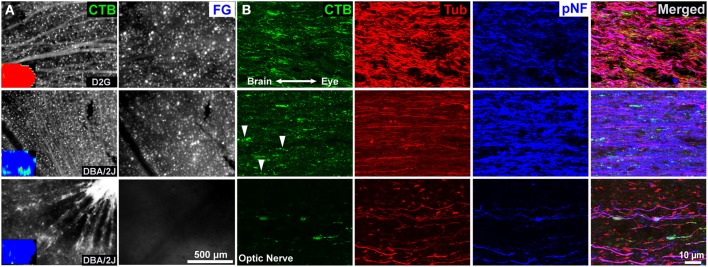
Figure 4.

Retina and optic nerve of three 12-month mice. (A) Representative images of whole mount retina showing CTB uptake and transport in retinal ganglion cells (RGCs). Insets are collicular CTB maps; red represents 100% of the pixels at that location positive for CTB, blue is no label. Top row: Control D2G mice with normal anterograde and retrograde transport. Dense CTB label is evident in RGC somata and axons, and retrogradely FluoroGold (FG) labeled RGCs are readily visible. Middle row: 12-month old DBA/2J with significant loss of CTB but ERRβ persistence. Despite a near complete loss of anterograde transport of CTB to the superior colliculus (inset), RGCs in the corresponding retina still take up and transport the CTB and FG tracers. Bottom row: 12-month old DBA/2J with advanced pathology—complete loss of both CTB and ERRβ in the SC. RGCs are still present and taking up/ transporting CTB within the retina. There is a loss of retrogradely transported FluoroGold (FG) in the retina. (B) Corresponding optic nerves near the optic chiasm. CTB is readily apparent in axons even in animals lacking collicular CTB (middle and bottom rows). The second row contains some “string of pearls” varicosities indicative of intra-axonal transport blockades as indicated by arrowheads. The projection with the most severe pathology (bottom row) contains large end-bulbs indicative of dying-back or distal Wallerian degeneration. β-Tubulin (Tub) labeling was lower in the DBA/2J mice with anterograde transport deficits (middle and bottom rows). Superphosphorylated heavy-chain neurofilament (pNF) labeling was increased in animals with selective anterograde transport deficits (middle row) and reduced in animals with severe deficits in both forms of transport (bottom row).
