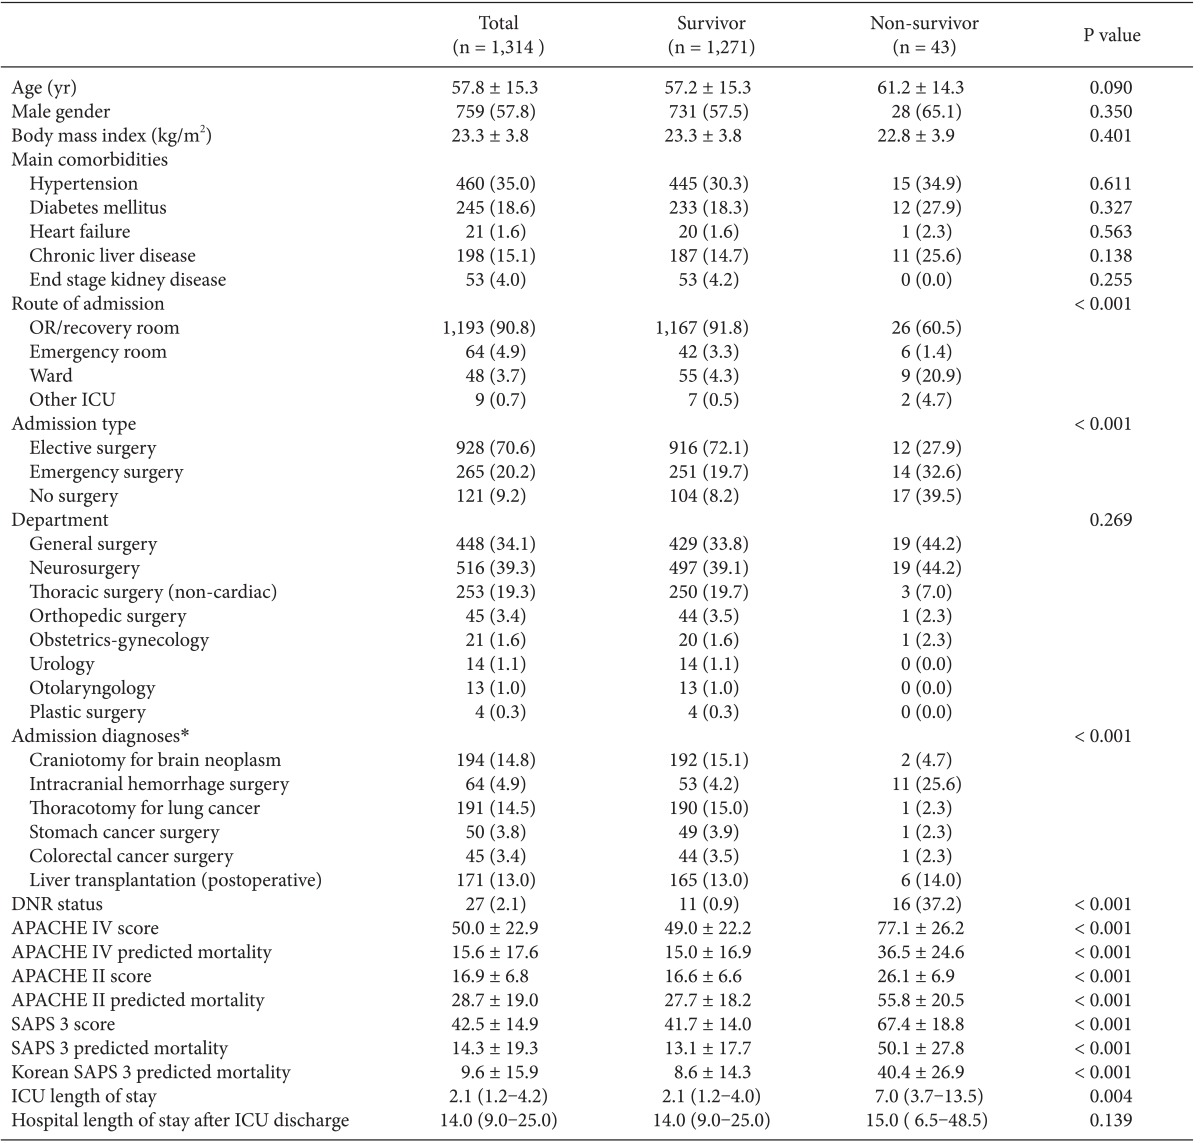
Table 1.
Patient Characteristics and Scores and Predicted Mortality on each Prognostic Model

Data are expressed as mean ± SD, median (interquartile range), or number (percent). OR: operating room, ICU: intensive care unit, DNR: do not resuscitate, APACHE: acute physiology and chronic health evaluation, SAPS: simplified acute physiology score. *Subpopulations based on admission diagnoses in the APACHE IV model.
