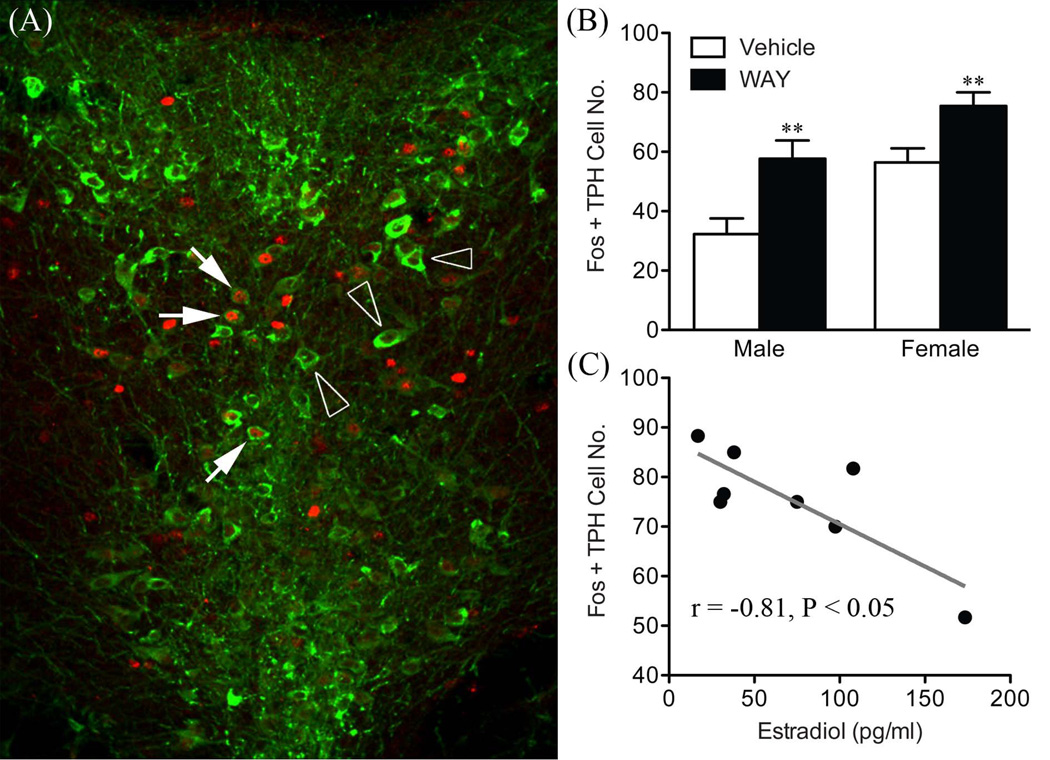
Figure 3.
Dual fluorescence confocal image to show overlap in nuclear Fos-ir (red) and cytoplasmic tryptophan hydroxylase (TPH; green) staining within the dorsal raphe nucleus (A). Solid arrows show doubly labeled neurons and open arrowheads mark Fos-positive, TPH-negative cells. Mean ± SEM relative numbers of double-labeled (Fos + TPH) neurons within the dorsal subdivision of the dorsal raphe nucleus in males and females (B). Scatterplot showing a significant negative correlation between plasma estradiol concentrations and Fos + TPH-labeled cells in the DRD of WAY females (C). **P < 0.01 vs. vehicle counterpart (n = 7–8 per group). Adapted with permission from Goel et al (83).

