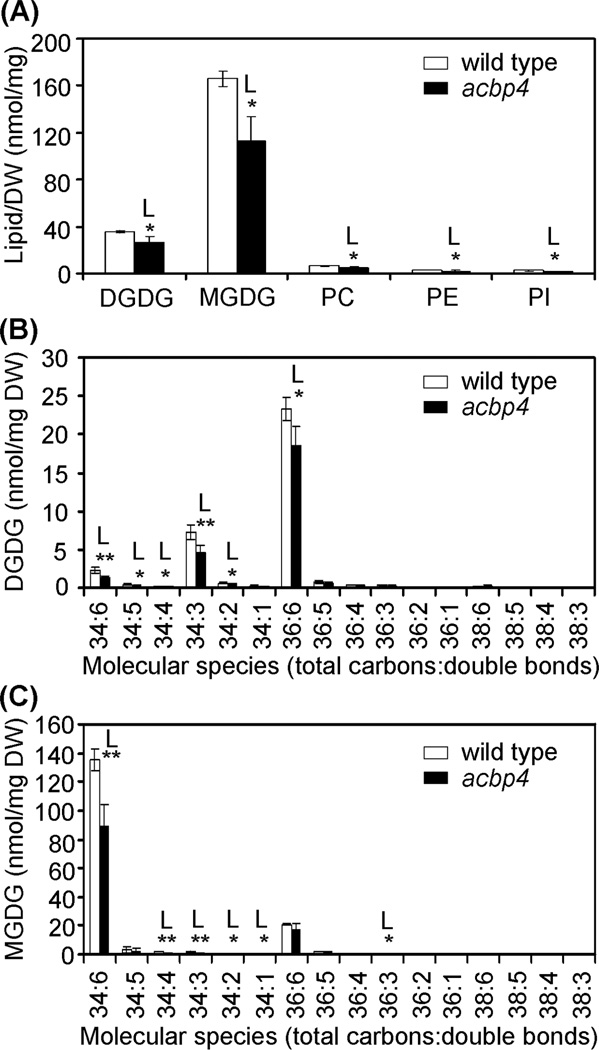
Fig. 8.
Polar lipid composition (a) and changes of DGDG (b) and MDGD (c) species in leaves of Arabidopsis wild type and acbp4 knockout mutant. Values are means ± SD (nmol/mg DW; n = 4). White and black bars represent WT and acbp4, respectively. “L” indicates that the value of the acbp4 mutant is lower than wild type in the same experiment (*, P < 0.05; **, P < 0.01 by Student’s t-test). DW, dry weight.

