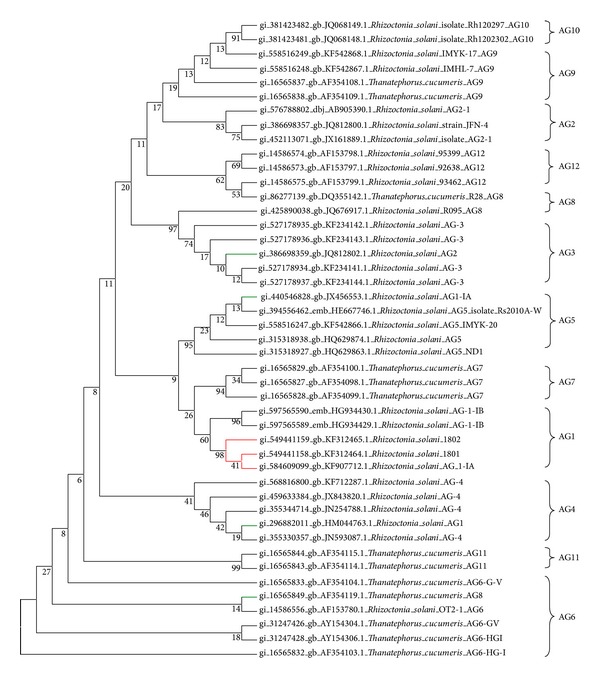
Figure 4.

Maximum Parsimony Analysis of Taxa. The evolutionary history was inferred using the evolutionary analyses that were conducted in MEGA 5.2 [45]. The red lines show our field isolates are clustered together with R. solani AG 1-1A. The green lines indicate the strains that have segregated out of their AG location.
