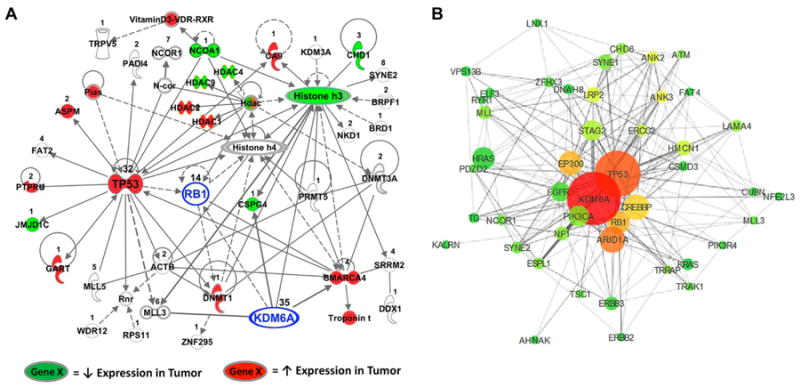
Figure 4. Biological and co-mutational connections of KDM6A to a network of genes with somatic mutations in BC.

A, The third most significant network (Fisher's Exact Test, p<10-42) constructed by IPA from genes with confirmed somatic mutations in BC, including KDM6A and RB1 (highlighted in blue). The number of independently identified mutations is listed above each respective gene. Evidence of direct (solid lines) or indirect (dashed lines) relationships between gene products is shown. Colored genes indicate decreased (green) or increased (red) gene expression in tumors compared to normal bladder samples in at least two out of three patient cohorts (FDR < 5%). B, The network was created using the co-mutation rate and the frequency of mutation to plot the mutations in 3D space. The size of each gene (node) is representative of the times it was mutated in different tumors. The connection lines (edges) in the network indicate whether the genes were found mutated together in the same tumor, with the length and thickness of each line shorter and wider with an increasing co-mutation rate. The nodes and edges of our model have been filtered to show only those genes found mutated in five or more tumors and edges between genes that were mutated together more than once. Node color corresponds to a gene's relative centrality score, with genes closer to the center of the network red and genes farther away turning to yellow then green at the periphery.
