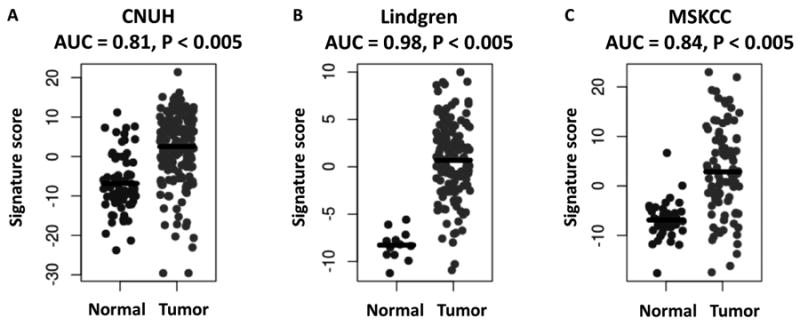
Figure 5. Relationship between a KDM6A signature score and BC.

The KDM6A signature score is plotted for normal and tumor samples in A, CNUH (n = 197), B, Lindgren (n=156), and C, MSKCC (n=129) cohorts. AUC, area under receiving operator characteristics curve, with AUC>0.50 corresponding to a signature score higher in tumor than normal samples. P-values were calculated by the Wilcoxon rank-sum test.
