
Figure 2.
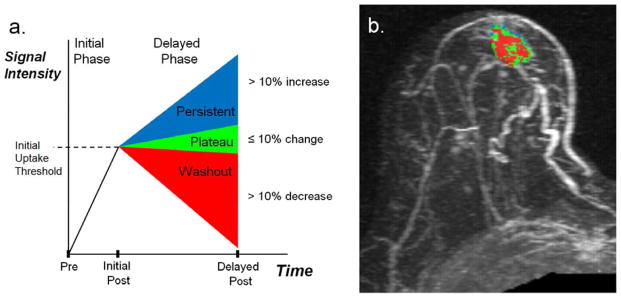
Process for characterization of DCE-MRI early and delayed phase enhancement patterns. Shown are (a) the enhancement criteria definitions and (b) example of lesion characterization in a 60-year-old female with a new diagnosis of a subareolar infiltrating ductal carcinoma in the right breast. (a) Initial Phase: Initial peak enhancement, defined as change in signal intensity between the pre-contrast and initial post-contrast sequence centered at 1.5 minutes post-contrast. Delayed Phase: Change in signal intensity between initial and delayed post-contrast sequence (4.5 or 7.5 minutes); defined as persistent enhancement (labeled blue) if signal intensity increases more than 10% or as washout enhancement (labeled red) if signal intensity decreases by more than 10%. A 10% or less change in delayed signal intensity is defined as plateau enhancement (labeled green). (b) DCE-MRI kinetics color overlay map where tumor voxels demonstrate peak initial enhancement greater than 50%, and the percentage of tumor voxels demonstrating persistent enhancement (blue) is 12%, plateau enhancement (green) is 43%, and washout enhancement (red) is 45%. Predominant curve type is washout; worst curve type is washout.