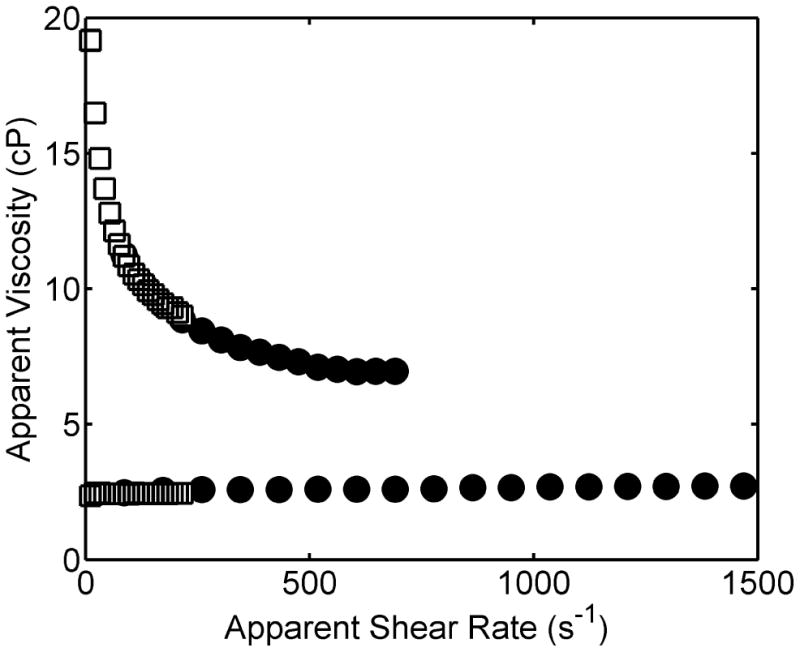
Figure 3.

Dependence of apparent viscosity upon apparent shear rate for a 28% w/w sucrose solution (lower curve) and a 1% w/w high molecular weight PEG solution (upper curve), at 20°C. The shear rate was varied by changing flow rate and by replacement of pressure tubing, as described in the text. Results indicated by filled circles were measured using pressure tubing of 0.01” inner diameter and 4.4 cm length. Results indicated by open squares were measured using tubing of 0.02” inner diameter and 20 cm length.
