
Figure 7. Development of menin-MLL inhibitors.
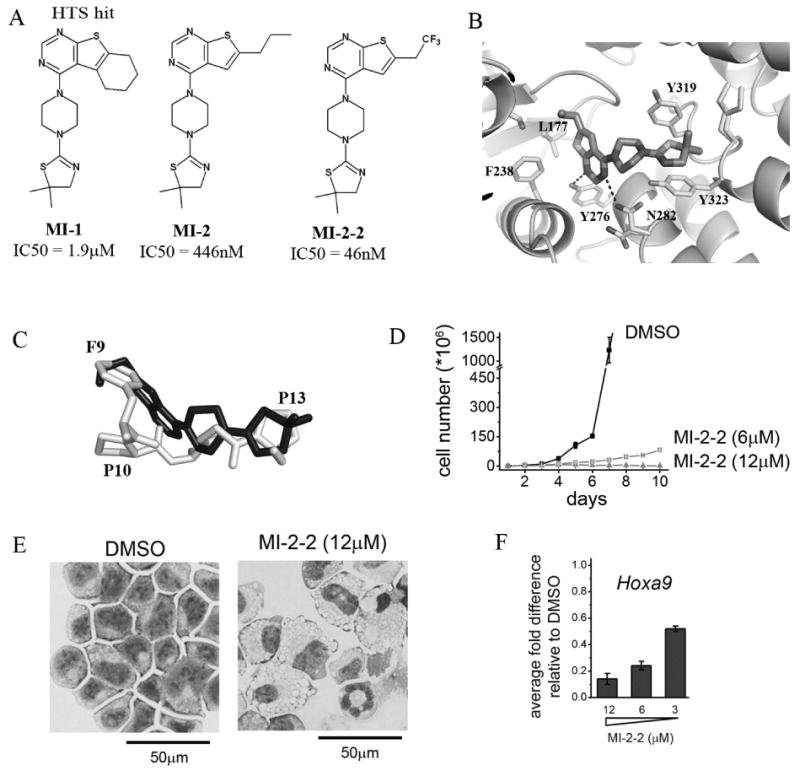
A) Structures and IC50 values for menin-MLL inhibitors: HTS hit MI-1, optimized analogue MI-2 and structure-based designed MI-2-2. B) Binding mode of MI-2 to menin from the X-ray structure of the complex (4GQ3 in PDB). C) Superposition of MI-2 (shown in black) with the fragment of the MBM1 motif (residues 9-13 are shown in gray) in a menin-bound conformation. D) Growth curves for MLL-AF9 transformed murine bone marrow cells (BMC) treated with MI-2-2. E) Wright-Giemsa-stained cytospins for MLL-AF9 transformed BMCs after 7 days treatment with MI-2-2. F) Quantitative real-time PCR showing the expression of Hoxa9 in MLL-AF9 transformed BMCs upon treatment with MI-2-2.