
Figure 2. Distribution of adenylyl cyclase (AC) isoforms in lipid (LRs) and non-lipid rafts (non-LRs).
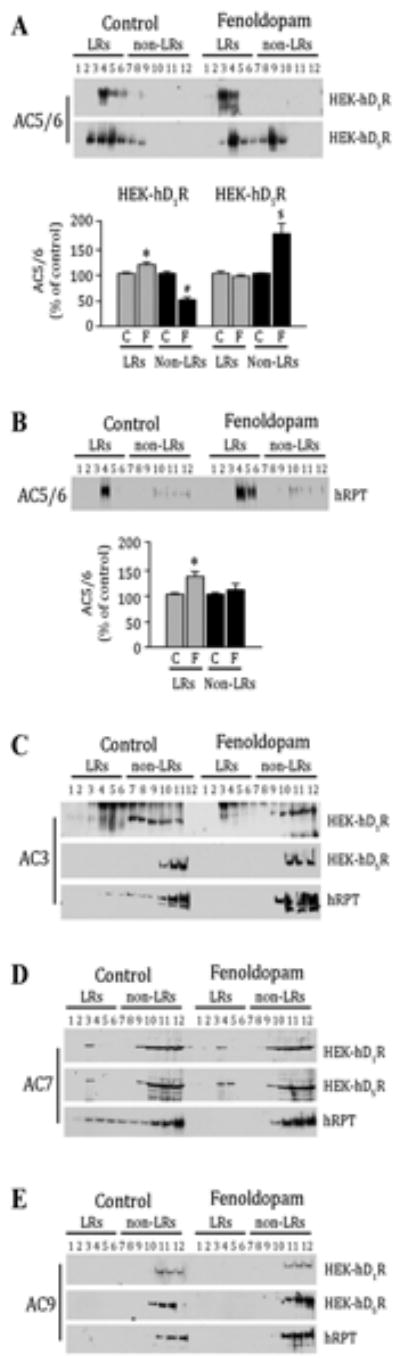
A-B. HEK-hD1R, HEK-hD5R, and hRPT cells were treated with vehicle (Control, C) or fenoldopam (F, 1 μmol/L) for 15 min. The cell lysates were then subjected to sucrose gradient centrifugation. Proteins (20 μl/lane) from sucrose gradient fractions (from 2 to 12 fractions) were immunoblotted with the antibodies against AC5/6. The immunoblot from one of 4-5 separate experiments is shown (upper panel). The immunoreactive bands for AC5/6 were semi-quantified as described previously (12, 27). The results are expressed as % of control for HEK-D1R and HEK-D5R cells in Figure 2A (lower panel) and for hRPT cells in Figure 2B (lower panel). Values are Mean ± SEM (n=4-5/group).
A: *P<0.01 and #P<0.001 vs. others in HEK-hD1R cells, $P<0.006 vs. others in HEK-hD5R cells, n4=/group, one-way factorial ANOVA, Tukey post-hoc test.
B: *P<0.05, vs others, n=5, one-way factorial ANOVA, Tukey post-hoc test.
C-E. Proteins (20 μl/lane) from sucrose gradient fractions (from 2 to 12 fractions) were immunoblotted with the antibodies against AC3 (Figure 2C), AC7 (Figure 2D), and AC9 (Figure 2E)