
Figure 6. Effect of silencing AC isoform genes on AC isoform protein and cAMP accumulation.
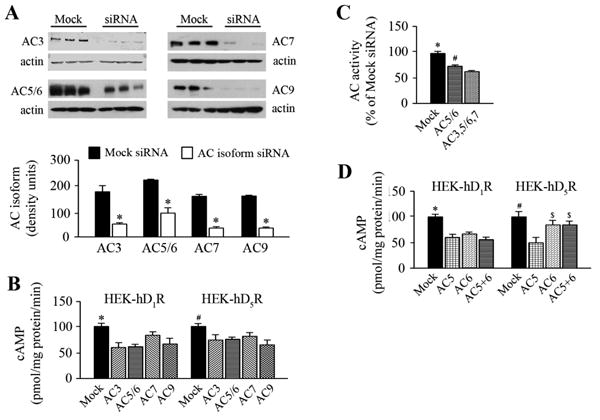
A. Effect of silencing AC isoforms genes on AC isoform protein
HEK-hD1R and HEKhD5R cells were seeded in 6-well plates at the cell density 5×10⁵/well. The cells were transfected with scrambled sequence (mock-siRNA) that served as a negative control, or AC isoformspecific siRNA (AC-siRNA) for 48 h. The cell lysates were immunoblotted with polyclonal antibodies against specific AC isoforms (upper panels). The immunoreactive bands were semiquantified and corrected for actin (lower panel). Values are Mean ± SEM (n=3/group). *,#P<0.001 vs. mock-siRNA, t-test.
B. Effect of silencing a specific AC isoform gene on cAMP accumulation
HEK-hD1R and HEK-hD5R cells were transfected with mock-siRNA or siRNA against theAC3, AC5/6, AC7, and AC9 genes. The cells were then treated with vehicle (Con) or fenoldopam (1 μmol/L) for 10 min. The cells were lysed in HCl solution at a final concentration of 0.1N. cAMP accumulation was measured in each well using a cAMP assay kit and expressed as pmol/mg protein/min. Values are Mean ± SEM (n=7/group). *P<0.05 vs. others in HEK-hD1R; #P<0.05 vs. others, in HEK-hD5R, one-way factorial ANOVA, Tukey post-hoc test.
C. Effect of silencing multiple AC genes on cAMP accumulation in HEK-hD1R cells. HEK-hD1R cells were transfected with mock-siRNA, AC5/6-specific siRNA, or a combination of siRNAs against AC3, AC5/6, and AC7 for 48 h. The cAMP accumulation in the cell lysate was measured as above. Values are Mean ± SEM (n=6/group). *,#P<0.001 vs. others, one-way factorial ANOVA, Tukey post-hoc test.
D. Effect of silencing AC5, AC6, or both on fenoldopam-stimulated cAMP accumulation
HEK- hD1R and HEK-hD5R cells were transfected with mock-siRNA or siRNA against AC5, AC6, or combination of AC5+AC6 for 48 h as described above. cAMP accumulation was measured in the cell lysates as above. Values are Mean ± SEM (n=3-6/group). *P<0.001, vs. all others in HEK-D1R (Figure 6D, left graph) and #P<0.003 vs. all others in HEK-hD5R and $P<0.05 vs. AC5-siRNA in HEK-hD5R (Figure 6D, right graph), one-way factorial ANOVA, Tukey post-hoc test.