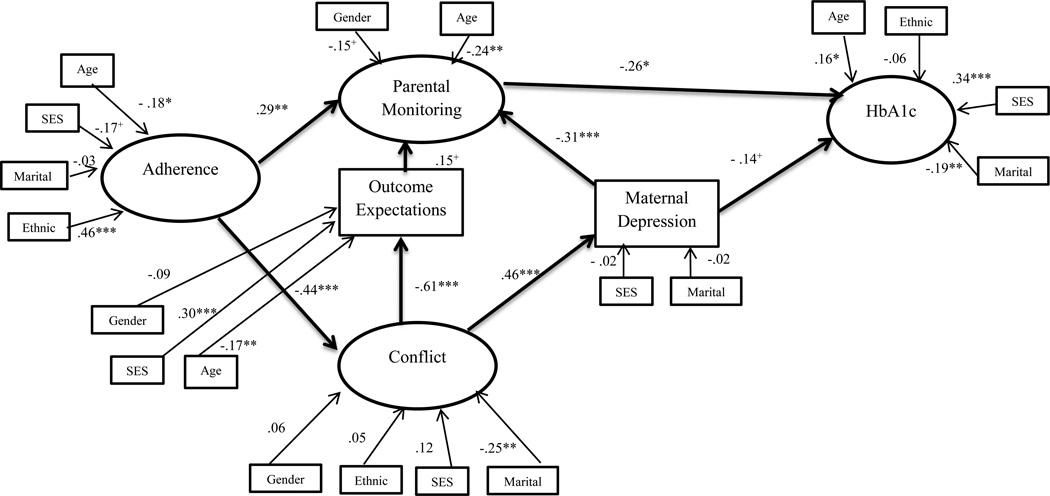
Figure 3.
Standardized path coefficients in model 2 initiated with adherence.
Note: Demographic and medical variables with significant bivariate correlations were included.
+ p <.10, * p<.05, ** p<.01, *** p<.001
Gender:0=male, 1=female; SES: lower values represent higher socioeconomic status; Ethnic: 0=non-white, 1=white; Marital: 0=not married, 1=married

