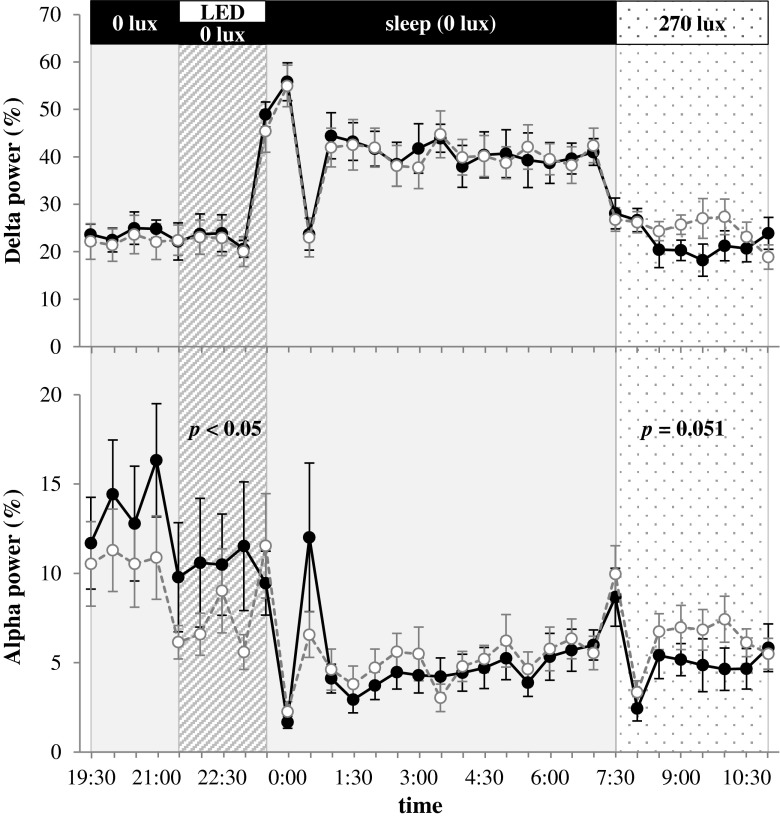
Fig. 2.
Delta and alpha power of EEG as percentage of total power. Average ± SE in 30-min intervals were plotted for blue light (open circle) and no light (filled circle) conditions. The percentage of alpha power in the blue light condition was significantly lower than that in the no light condition during the light exposure (p < 0.05; Wilcoxon signed rank test)

