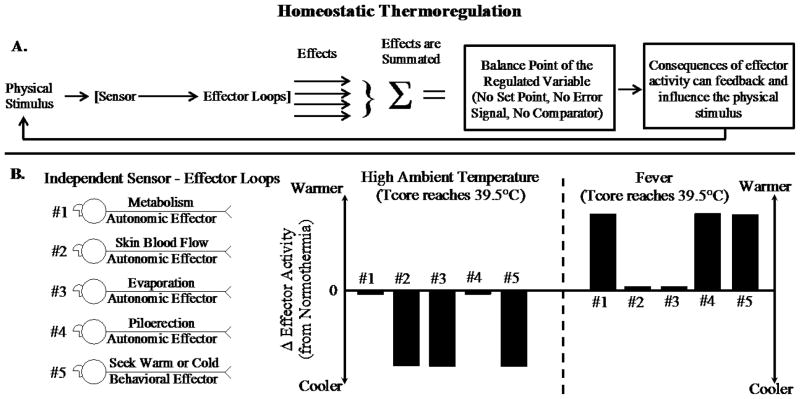
Figure 3.
Schematic describing how a homeostatic model explains thermoregulatory effector activity when body temperature (Tcore) is comparably elevated due to being in a high ambient temperature or an infection-induced fever. Panel A. Schematic depicting how the activity of multiple independent sensor-effector loops contributes to the balance point of a regulated variable. Panel B. Two different patterns of effector activity (adjusted for basal activity levels during normothermia) that result from five different thermo-effector loops. When ambient temperature is high, cooling responses are activated; during a fever, warming responses are activated. As in Gordon’s homeostatic model (see Fig. 1), the same pattern of coordinated effector activity occurs to move Tcore in the same direction, but this approach does not measure the value of the regulated variable and compare it to a set-point value.

