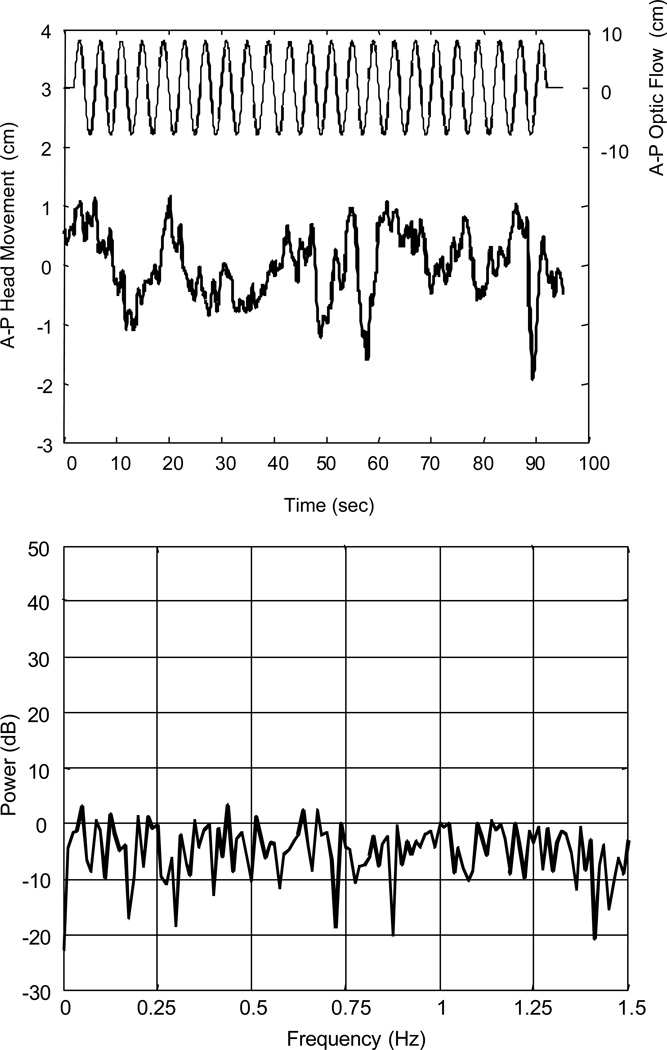
Figure 4.
Anterior-posterior (A–P) head translation of subject B obtained while viewing 0.25 Hz optic flow. Top: Time series showing head translation (thick line) and optic flow stimulus (thin line). Bottom: Periodogram of head translation, after pre-whitenting filter was applied. No observable peak at 0.25 Hz is present.

