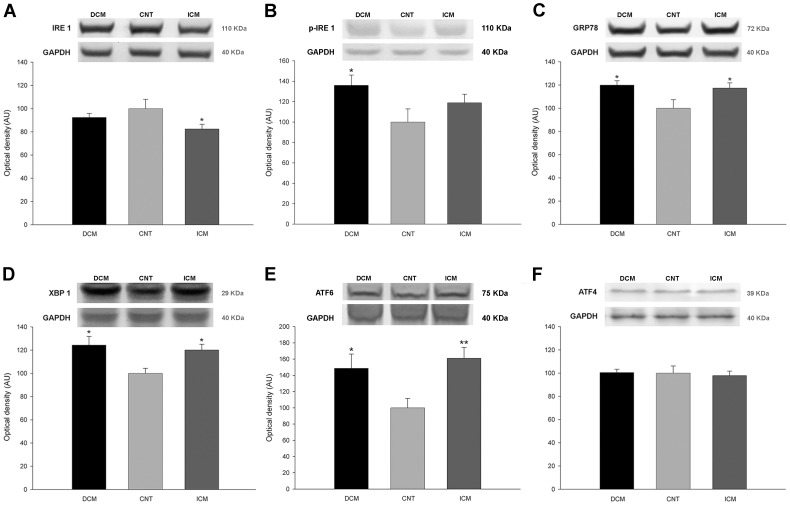
Figure 1. Protein expression levels of endoplasmic reticulum stress proteins in dilated (DCM) and ischemic (ICM) cardiomyopathy and control (CNT) groups.
(A) Inositol-requiring protein-1 (IRE1). (B) Inositol-requiring protein-1 phosphorylated (p-IRE1) (C) Glucose-related protein 78 (GRP78). (D) X-box binding protein 1 (XBP1). (E) Activating transcription factor 6 (ATF6) (F) Activating transcription factor 4 (ATF4). The values are normalized to GAPDH and finally to the CNT group. Values from the CNT group are set to 100. The data are expressed as means ± standard error of the mean (SEM) in optical density, arbitrary units (AU), of six independent experiments. *p<0.05, **p<0.01 vs. the CNT group.

