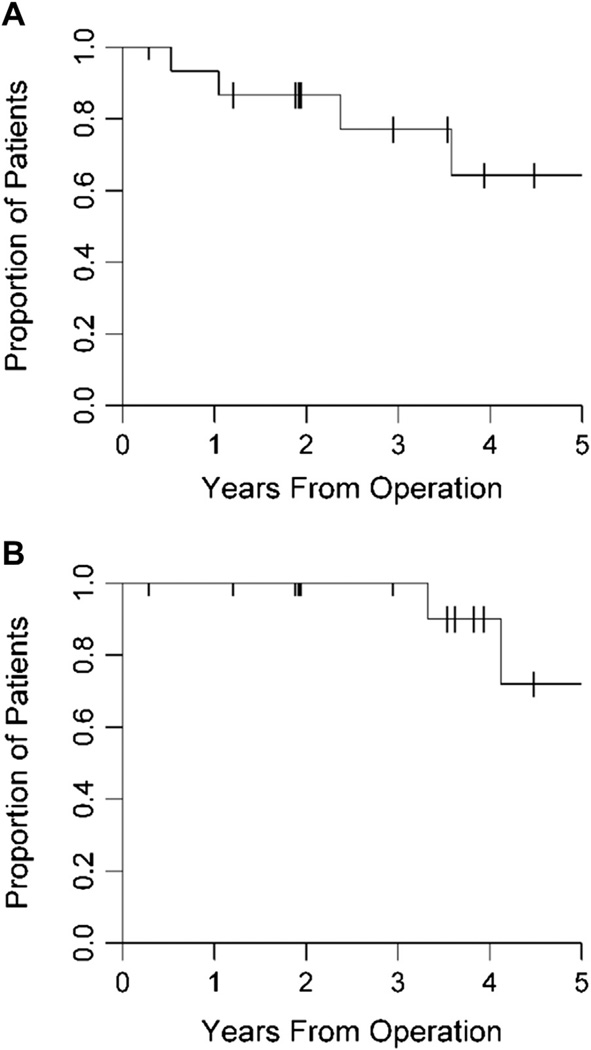
Fig.
(A) Time to LR was generated and analyzed from the date of diagnosis using the Kaplan–Meier method. The 5-y LR free rate for our patient population is 64%. (B) OS was generated and analyzed from the date of diagnosis using the Kaplan–Meier method. The 2- and 5-y OS rates for our patient population are 100% and 72%, respectively.

