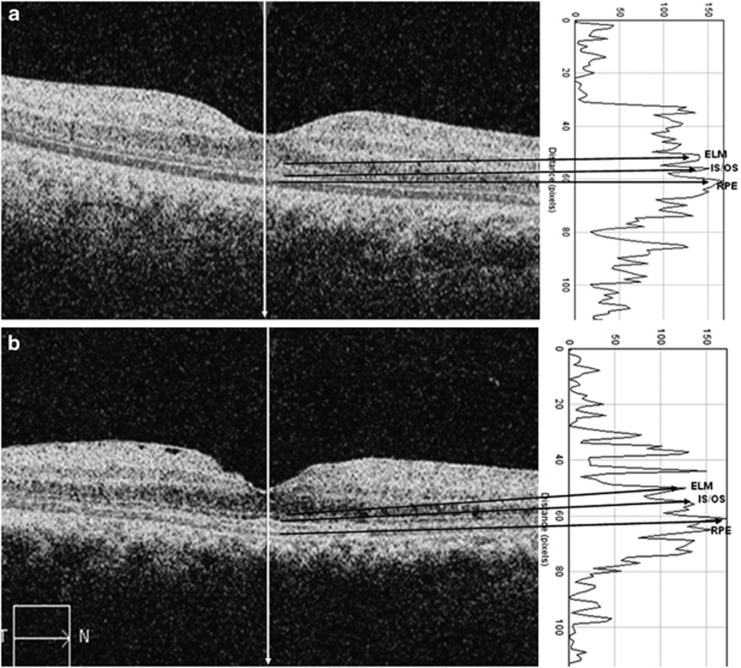
Figure 1.
Gray-scale OCT images (left) of a control subject (a) and IEMM patient (b), and peaks of RPE, photoreceptor IS/OS junction, and ELM on reflectivity graph (right) obtained from image processing program (ImageJ) are shown. ImageJ gives reflectivity values along a line (vertical white arrow) and creates reflectivity graph.

