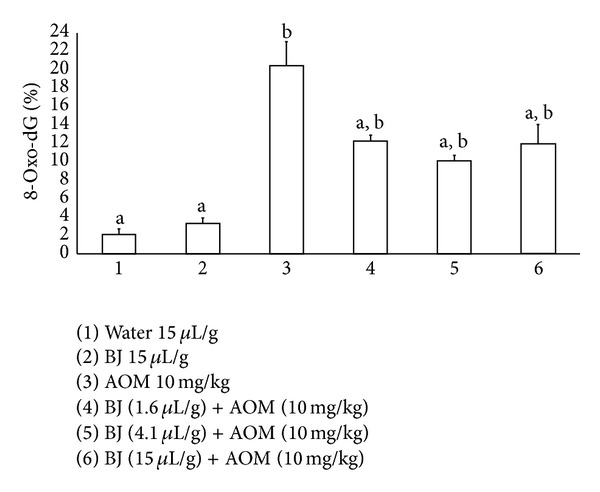
Figure 2.

Quantification of 8-oxo-dG adducts in mice treated with blueberry juice (BJ) and azoxymethane (AOM). Each bar represents the mean ± SD obtained in the colon of each group. Eight mice per group. aStatistically significant difference with respect to the AOM value; bwith respect to the control value. ANOVA and Student-Newman-Keuls tests, P ≤ 0.05.
