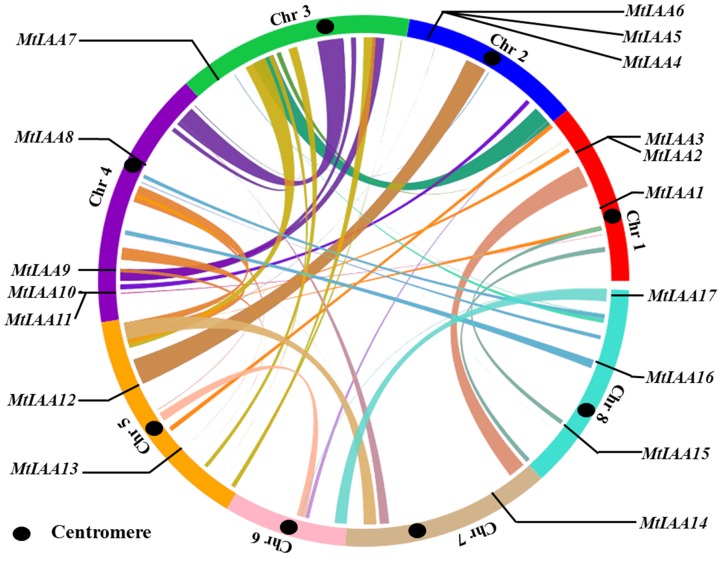
Figure 1. Chromosome mapping of MtIAA family genes.
The genome visualization tool CIRCOS was employed. Medicago truncatula chromosomes are arranged in a circle, and the centromere of each chromosome is marked in black. Ribbon links represent the segmental duplication region retrieved from the SyMAP database. MtIAA family genes are mapped by locus.

