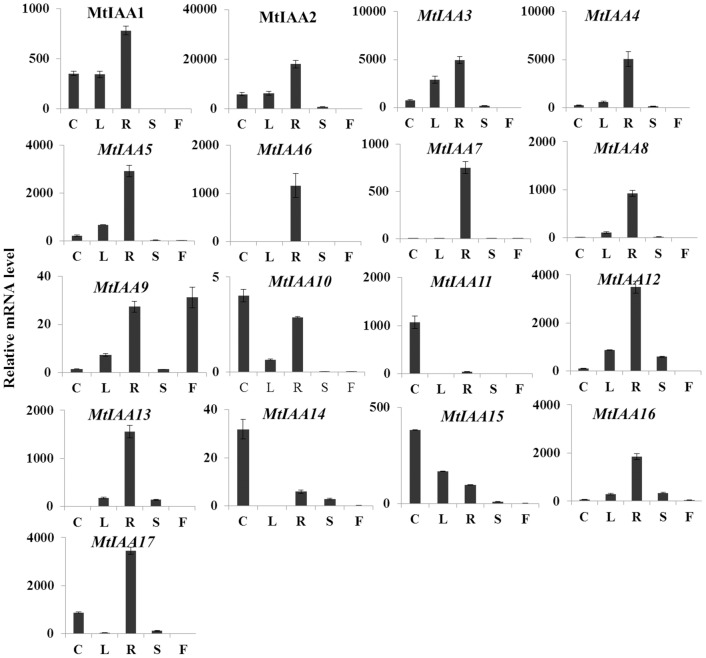
Figure 4. Tissues-specific expression patterns of MtIAA genes.
Based on the phylogenetic analysis, all MtIAA genes were grouped into five subfamilies (A: subfamily A; B: subfamily B; C: subfamily C; D: subfamily D; E: subfamily E). Expression patterns of the MtIAA genes in five indicated organs were analyzed by the data of qRT-PCR. The value of ACTIN (Cotyledon)/1000 defines as 1. C: cotyledon; L: leaf; R: root; S: shoot; F: flower. The data were analyzed by five independent repeats, and standard deviations were shown with error bars.

