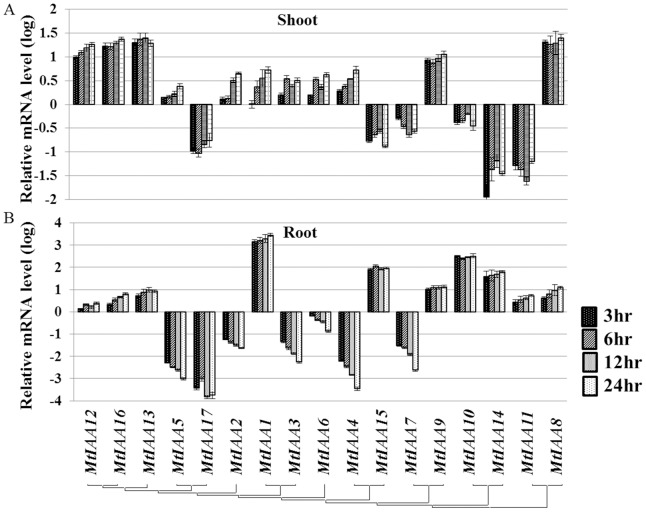
Figure 5. Real-time quantitative RT-PCR (qRT-PCR) analyses of MtIAA genes in plants under IAA treatment in both shoots (A) and roots (B).
Total RNA was extracted from the shoots and roots of M. truncatula seedlings for basal expression. The histogram shows the relative expression level of MtIAA genes under IAA treatment compared to the mock expression level. The relative mRNA level of individual genes was normalized with respect to the MtACTIN gene. The concentration of synthetic IAA was 0.1 µM. Samples of two different organs (shoots and roots) were used to test the changes of MtIAA genes expression level at different time points (3 hr, 6 hr, 12 hr and 24 hr). The data were analyzed by five independent repeats, and standard deviations were shown with error bars.

