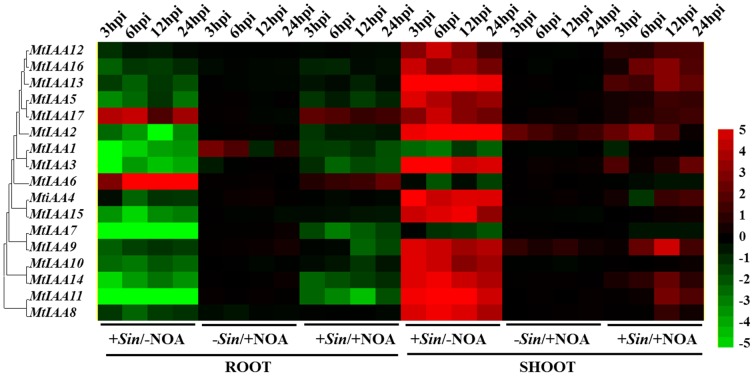
Figure 8. Heat map showing MtIAA genes expression pattern at the early phase of Sinorhizobium meliloti infection under different conditions.
Samples of two different organs (shoots and roots) were used to test the changes of MtIAA genes expression level at different time points (3/6/12/24/48/72 hpi) and conditions (−Sin/−NOA, +Sin/−NOA, −Sin/+NOA and +Sin/+NOA). The treatment –Sin/−NOA was used as mock treatment. The different colors correspond to the log-transcription values of the gene change-fold ratio shown in the bar at the right of figure.

