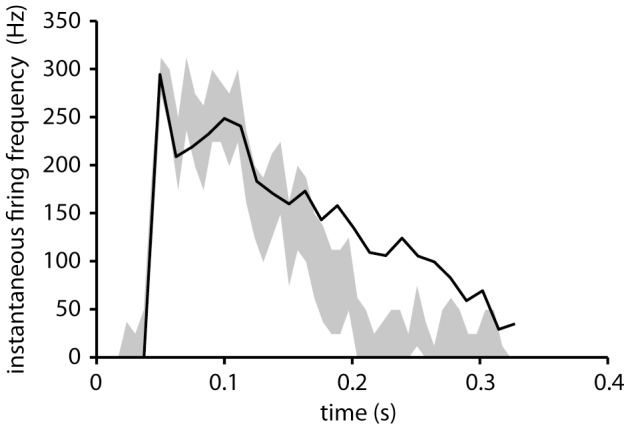
Figure 5. SBC model prediction compared to actual firing recorded in a VSCT neuron.

The spike response of the SBC model to an input intracellular signal recorded during one step cycle (adapted from [9]). The gray area indicates the 95% confidence bounds of the model response and the solid line the average measured instantaneous firing frequency from 12 cycles [9]. Note that while the model does not reproduce the measured response beyond 0.2 s, it captures the initial transient from 0 to approximately 300 Hz, and also the subsequent slow decay of the firing frequency. Since the input to the model and the firing frequency are naturally not from the same step cycle, perfect overlap cannot be expected.
